
Contents
LiveView server offers rich functionality for querying your streaming data. LiveView server has a built-in SQL-like query language, LiveQL, the LiveView query language.
This document demonstrates three ways to run queries:
-
Use the Java Client API to run a query.
-
Run a command-line query using lv-client.
The LiveView Java Client API lets you create your own custom client to connect to a LiveView Server. You can use the Java Client API to create queries.The sample_lv-java-clientapi provides example queries that you can run against the sample_lv-helloliveview project.
Load this sample using the same steps you used for sample-lv-minimal. Once you have loaded the sample, you can view the file structure in the SB Authoring perspective of StreamBase Studio.
The Java source files are contained in the sample_lv-java-clientapi folder, src/main/java subfolder, under the com.streambase.liveview.sample.client package. The files in this demo are:
- SimpleQuery.java
-
Demonstrates how to use the LiveView Java API to connect to and query a table.
- QueryWithLiveResult.java
-
Demonstrates a simple query that uses a LiveResult query listener to provide continuous updates.
- QueryWithFilter.java
-
Demonstrates a query that selects a subset of columns from a table and filters the results using a simple predicate.
- ConnectAndListTables.java
-
Demonstrates how to connect to a LiveView server and list the LiveView tables.
- DynamicAggregation.java
-
Demonstrates a dynamic aggregation query.
- AdvancedConnect.java
-
Demonstrates the use of a progress monitor listener that reports the progress of connection and disconnection events.
The comments in the source files explain more about how the queries work. To run a query, follow these steps:
-
Open the Java file in StreamBase Studio. When you open the file, Studio silently compiles the file.
-
Right-click anywhere in the Editor canvas and select >.
-
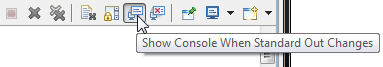
Set the Console to view the query output. By default, the Console view updates when standard output changes. To display the query results only, de-select the Console tab button Show Console When Standard Out Changes:
For example, DynamicAggregation.java contains the following query. This query aggregates the quantityRemaining column grouped by color:
QueryConfig queryConfig = new QueryConfig().
     setSelectExprs("category", "sum(quantityRemaining) as totalQty").
     setTable("ItemsSales").
     setPredicate("quantityRemaining > 10").
     setGroupByExprs("category").
     setQueryType(LiveViewQueryType.SNAPSHOT_AND_CONTINUOUS);
This query is of type SNAPSHOT_AND_CONTINUOUS. The snapshot part of the query returns results like the following:
Begin snapshot, query result fields are:
  category string
  totalQty int
Tuple added, key: 2, tuple: toy,45702
Tuple added, key: 4, tuple: book,58475
Tuple added, key: 3, tuple: clothes,52316
Tuple added, key: 1, tuple: automotive,65872
Tuple added, key: 5, tuple: electronics,172951
Snapshot ended
You can add aggregates to setSelectExprs using the list syntax. For example, you can add an average value field to the query output by changing the setSelectExprs argument:
setSelectExprs("category", "sum(quantityRemaining) as totalQty",
avg(lastSoldPrice) as avgPrice")The command-line tool lv-client is run at a DOS or UNIX command line, and provides basic query functionality without using StreamBase Studio. The following example for Windows demonstrates how to start the Alerting sample project from the command line and run queries against the project's tables.
Note
If you have an instance of LiveView Server currently running, use the lv-client shutdown command before you run the sample.
These steps presume you have loaded the Advanced Alerting sample into StreamBase Studio.
-
Open a StreamBase Command Prompt. Do not use a standard Windows command prompt.
-
Navigate to the directory that contains your Studio workspace. The following example on Windows shows the location of the Studio workspace of the user named
sbuser:cd "C:\Users\
sbuser\StreamBase Studiom.nWorkspace" -
Run the Alerting sample.
lv-server run sample_lv-alerting-advanced
-
The command prompt window in which you start LiveView Server shows a series of messages reporting the progress of the server as it starts. Wait for a message that says:
{ Server Started } -

(... "All tables have been loaded. LiveView is ready to accept client connections. ")
The command prompt window then pauses and waits to display any runtime messages that may be necessary.
-
Open another StreamBase Command Prompt. You can use this second prompt to issue queries against the current LiveView server instance.
-
Start lv-client:
lv-client
You can see syntax help for the lv-client at any time by typing
help; -
Connect to the local server. The connect command without any arguments connects to LiveView Server running on the local machine with the default port number, 11080:
LV>connect;
If you wanted to connect to a remote machine and a specified port number, you would use the following syntax:
connect lv://
hostname:portnumber; -
List the tables in the currently running project:
LV> listtables;
-
Run a snapshot query for the ItemsSales table:
LV> select Item,category,quantityRemaining from ItemsSales where lastSoldPrice < 30;
-
Run a snapshot query that shows only the five items that have the smallest values for the quantityRemaining field:
LV> select Item,category,quantityRemaining from ItemsSales order by quantityRemaining limit 5;
-
Run a snapshot query against the LVAlerts table that shows all alerts created in the last 30 seconds:
LV> select * from LVAlerts when Created between now()-seconds(30) and now();
-
Exit from the lv-client prompt back to the shell prompt:
LV> quit;
You can use LiveView Web to create, save, and edit queries that continuously run against LiveView tables. This example demonstrates how to write a query in LiveView Web that returns a continuously updating view of all table rows where the query predicate conditions evaluate to true. This example uses the LiveView Web sample project, which itself is based on the Hello LiveView sample project.
From a web browser running LiveView Web, cards represent visual displays of query results of a streaming data set. From a card, you select a table against which to apply a query, as well as determine the predicates and parameters that are used to provide streaming data to a visualization within LiveView web.
-
Start StreamBase Studio in the SB Authoring perspective.
-
Load the LiveView Web sample:
-
Select > from Studio's top-level menu.
-
Enter
LiveViewin the filter field to narrow the selection. -
Select the Spotfire LiveView Web Sample from the Spotfire LiveView category.
-
Click .
The LiveView Web sample loads into Studio with the project name
sample_lv_sample_lvweb. If you already have a project folder of that name, Studio adds a counter digit to the folder name and adds a new project. -
-
In the Project Explorer view, select the name of the project, right-click, and from the context menu, select >. The Console view shows several messages as the LiveView Server compiles the project and starts. This startup process can take several minutes, depending on the configuration of your computer.
-
Point your web browser to the LiveView Web application landing page (typically http://localhost:11080/lvweb).
-
Log on as admin/admin. For more details regarding the sample, refer to its README file.
-
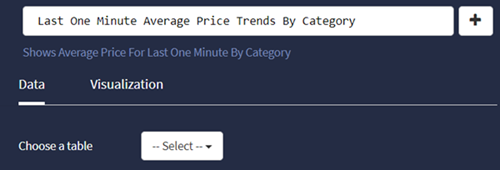
From your browser, hover your mouse in the LiveView Web card and click the pencil icon to edit the card's query.
This example uses query options based on the Last Minute Price Trends By Category card.
-
Choose a table from the dropdown list.
-
Enter your query predicate into the Query window. The Query window also provides a link to LiveView's Query Language reference documentation.
The following example selects everything available from the ItemsInventory table:
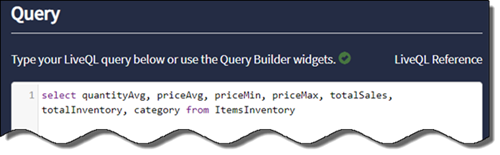
-
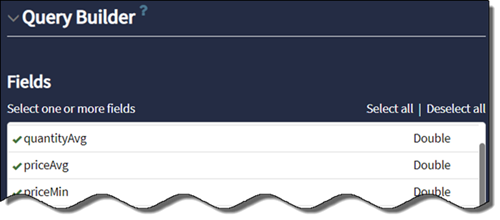
Use the Query Builder to optionally select or deselect fields to display in the card:
-
To add a GROUP BY expression, under select a field from the drop-down list. LiveView Web displays additional information based on your selection.
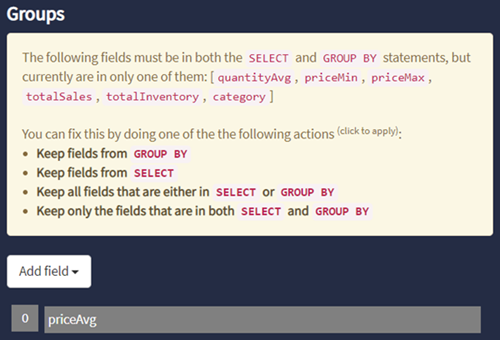
Selected fields for the Group appears under the instructions.
-
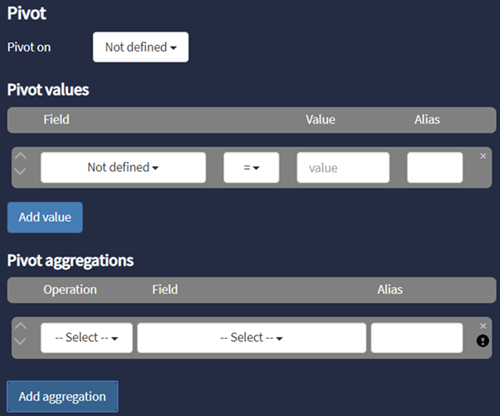
To add a pivot modifier to your query, select a table column on which to pivot, from the dropdown list. Continue to refine the pivot query by clicking respective buttons to add pivot values and pivot aggregations.
-
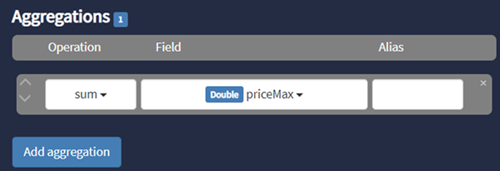
Click to add an aggregation expression to your query. Specify the aggregate conditions as needed.
-
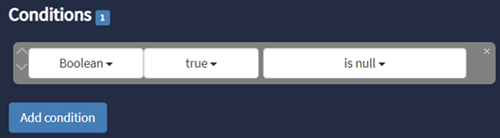
Click to include additional granularity to your query.
-
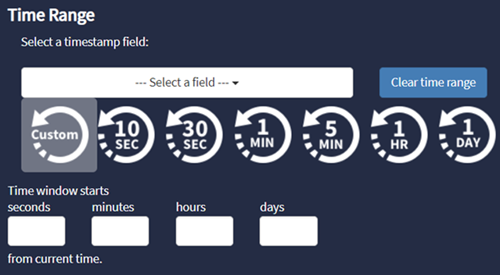
Query the data by specifying a time range, which can be in increments spanning seconds to days.
-
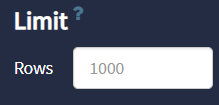
Limit the number of returned rows for your query returns. The default row limit is 1000. Override the limit or leave blank to restore the default value.
LiveView supports query sharing between connected clients and is enabled by default. To fine-tune query sharing for additional
performance, add any of the following system properties to your LiveView project's LDM Engine configuration file. The configuration file must be added to your project's src/main/configurations folder.
The following properties are shown with their default values. Modify them as required.
Minimum number of queries of the same type before sharing begins. To always share a query, set the value to 1. To disable sharing, set the value to a very large number, such as INT_MAX.
liveview.queries.sharing.min = 2
Maximum cache size for shared queries (in tuples). Query results exceeding the set value are not shared:
liveview.queries.sharing.cache.size = 10000
Maximum shared query cache memory size of all local queries. Remote queries get a separate cache pool of the same size.
liveview.queries.sharing.cache.mem = 62914560
System properties defined in an LDM Engine configuration file:
systemProperties = {
  "liveview.queries.sharing.min" = "2"

  "liveview.queries.sharing.cache.size" = "10000"

  "liveview.queries.sharing.cache.mem" = "62914560" //60 MiB
}