
Contents
- Overview
- Output Streams View Features
- The View's Toolbar
- Streams Shown in Standard versus ISD Mode
- Select One Stream or All
- Select Multiple Streams
- Select Streams with ISD Enabled
- Stream Selection is Persisted
- The Details Pane
- Clearing the View
- Sort By Columns
- Show or Suppress the Time Column
- Copy Tuples to Clipboard
- Scroll Lock
- Filtering Tuples
- Creating a New StreamBase Unit Test Class
- Creating a New Output Streams View
- Disable Dequeuing
- Preference Settings
- Related Topics
The Output Streams view shows tuples as they are emitted from a running application. In the default layout, the Output Streams view is located at the bottom left corner of the SB Test/Debug perspective, sharing the bottom left Eclipse folder with the Input Streams and other views.
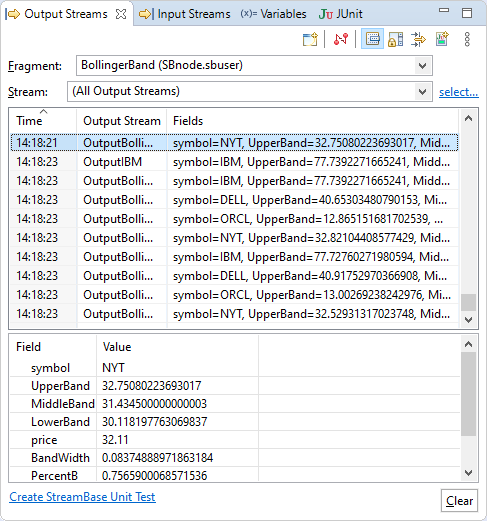
The figure below shows an example Output Streams view of the running Bollinger Band sample, which is included with StreamBase. This figure illustrates several features of the Output Streams view, which are discussed in the next section.
The Output Streams view has the features described in the following subsections:
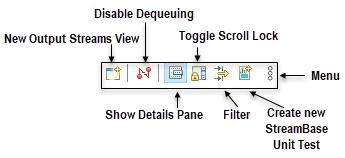
The buttons on the Output Streams view's toolbar are used as shown in the following illustration.
 |
The area to the left of the toolbar is used to display messages, such as the current status of the tuple filter.
The use of each button is described in the following sections below:
The Output Streams view shows the output of different sets of streams, depending on how you started the currently running application:
-
Run. If you started the application with the
 button in Studio's toolbar, or with a run configuration, then by default, the view shows the output of all output streams.
-
ISD Enabled. If you started the application with a run or debug configuration that enables intermediate stream dequeuing (ISD), then the view shows the output of all output streams, all input streams, and all intermediate streams.
See Intermediate Stream Dequeuing for more information on intermediate streams.
When you first start an application running in Studio, the Output Streams view is set for (All Output Streams) to show the output of all available streams in the running application, as described in the previous section.
Use the dropdown list in the Stream field to select a single stream. This restricts the view to the output of the selected stream.
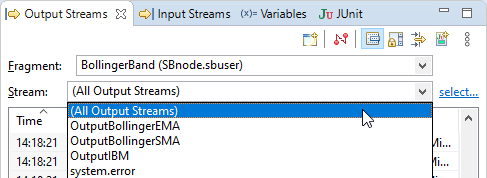 |
The list of streams always includes the system.error stream.
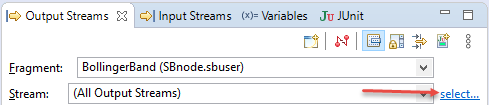
You may need to restrict the view to the output of two or more streams, but fewer than all streams in the application. In this case, click the select link on the right side of the Stream field.
 |
This opens the Output Stream Selector dialog, like the following example:
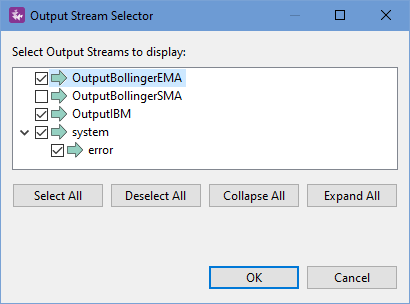 |
Select two or more streams and click . When the dialog closes, the Stream field shows a comma-separated list of the selected stream names, including the error stream from the system container.
When running or debugging a top-level application that references one or more modules, the Output Stream Selector dialog organizes the available output streams hierarchically, to help you locate the streams of interest.
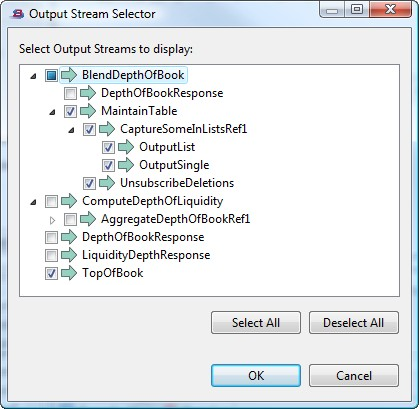 |
With intermediate stream dequeuing enabled, the Output Stream Selector dialog shows a larger list of streams whose output you can monitor.
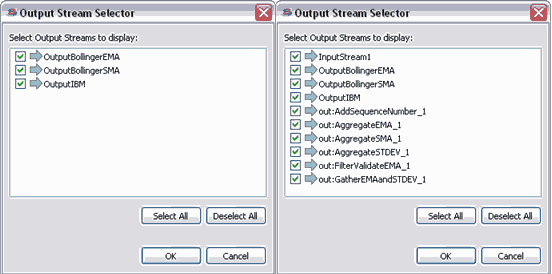
The following illustration shows the Output Stream Selector dialog for two cases of running the Bollinger Band sample installed with Spotfire Streaming.
-
You see the dialog on the left when running with the default run configuration. It shows only the three output streams defined in the application.
-
You see the dialog on the right when running with intermediate stream dequeuing enabled. It shows the same three output streams plus the output port of all intermediate components as selectable streams.
 |
See Intermediate Stream Dequeuing for more information on intermediate streams.
For each application or module run in Studio, the selection of output streams you select for viewing in the Output Streams view is saved, and Studio restores the same stream selection the next time you run the same application. The saved stream selections persist even if Studio is closed and reopened. When you launch another application for the first time, the stream selection in the Output Streams view is reset to All Streams.
The Details pane is enabled by default when an application starts running. Click the ![]() button in the view's toolbar to disable and re-enable the Details pane.
button in the view's toolbar to disable and re-enable the Details pane.
By default, nothing shows in the Details pane. Select any tuple row in the output table to see a tree display of the individual fields of the selected tuple. The figure above shows an example of a populated Details pane.
If the selected tuple contains fields of the tuple data type, then by default, the Details pane shows each tuple field in a single row with a arrowhead on its left:
 |
Click each arrowhead to see the contents of each tuple field:
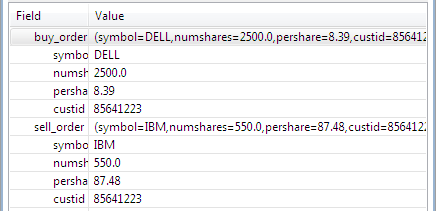 |
Tuple fields can be nested inside other tuple fields to any depth. Nested tuples are shown with indentation:
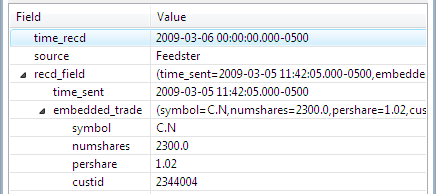 |
Fields with the list data type are shown with their contents in array form on a single line with an open arrowhead to its left. Click the arrowhead to see the individual elements of the list field, one per line:
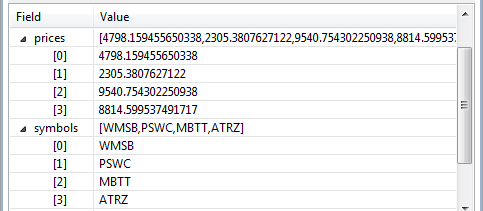 |
The button on the bottom right of the view clears all tuples currently in the view.
By default, the Output Streams view is cleared whenever you restart an application. Clear the Clear on Application Restart checkbox to preserve tuples between runs of an application.
Click a column header to sort the output table lexicographically by that column. An up or down arrowhead above the column title shows the current ascending or descending sort order. Click the column header again to change the sort order.
Sorting the output table makes the most sense when examining the output of an application after it has run and stopped. In this case, you might, for example, sort the table by the Output Stream column to group the tuples by stream. You might also sort the output table before saving portions of it to a file or to a CSV file.
It is possible to click a column header while the application is running and still emitting output tuples. However, doing this is not guaranteed to produce useful results. For example, after you click a column header, newly emitted tuples are still placed at the bottom or top of the table (depending on sort order), and are not automatically sorted into place elsewhere in the table while the application is still emitting tuples. It is a best practice to stop or pause the application before using the column sort feature.
By default, the Output Streams view shows the time received for each tuple in the output grid. (For applications fed by a fast feed simulation, the timestamps in this column can be the same for dozens or even hundreds of rows.)
You can suppress the Time column as follows:
-
Select any row in the output grid.
-
Right-click to display the context menu.
-
Select Show Time column from the context menu. The check mark shows the current state of the Time column.
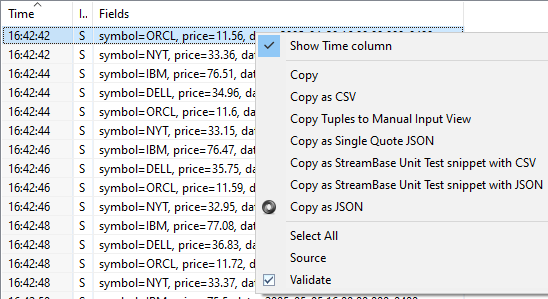
You can copy the selected rows in the output grid to the system clipboard, either as plain text or in one of several formats. You can use the Copy as options to generate input or output data for a StreamBase JUnit test.
Follow these steps:
-
If necessary, sort the table to group together the tuples of interest. See Sort By Columns.
-
Select one or more rows that you want to copy. Hold down the Ctrl key while clicking to select noncontiguous rows. To specify all rows in the grid, use Select All from the context menu, or press Ctrl+A.
-
Right-click to display the context menu.
-
Select Copy or one of the Copy as options to copy the selected rows, as described below.
Use the various Copy options as follows. In all cases, examples are shown with long lines wrapped for publication clarity, but the lines are copied to the clipboard without wrapping.
- Copy
-
The selected rows are copied to the clipboard as plain text with a column header row, including both field names and field values. The Time column's value is included or not, depending of the setting of the Show Time column option.
Time  Output Stream  Fields
10:42:41  OutputIBM  symbol=IBM, UpperBand=94.6431225476753,
  MiddleBand=81.38050000000001, LowerBand=68.11787745232472,
  price=75.91, BandWidth=0.32594104355896786,
  PercentB=0.29376250887276817, date=2005-04-28 16:00:00.000-0400
- Copy as CSV
-
The selected rows are copied to the clipboard as a comma-separated value string, using the CSV standard rules. The Time column's value is included or not, depending of the setting of the Show Time column option. When used in the Input Streams view, this option generates a string that can be sent to the specified input stream using sbc enqueue or using a custom client application.
10:42:41,IBM,94.6431225476753,81.38050000000001,68.11787745232472,75.91,
  0.32594104355896786,0.29376250887276817,2005-04-28 16:00:00.000-0400
- Copy Tuples to Manual Input View
-
This option offers a convenient way to re-run a tuple from an input stream.
StockPriceInput symbol=DELL, price=35.52, date=2020-03-10 16:00:00.000-0400
- Copy as JSON
-
The selected rows are copied to the clipboard as a JSON object in which double quotes are used to designate string field names and field values.
{"symbol":"IBM","UpperBand":94.6431225476753,"MiddleBand":81.38050000000001, "LowerBand":68.11787745232472,"price":75.91,"BandWidth":0.32594104355896786, "PercentB":0.29376250887276817,"date":"2005-04-28 16:00:00.000-0400"} - Copy as Single Quote JSON
-
The selected rows are copied to the clipboard as a JSON object in which single quotes are used to designate string field names and field values. Use this option to generate JSON-formatted tuples for use in StreamBase JUnit tests.
{'symbol':'IBM','UpperBand':94.6431225476753,'MiddleBand':81.38050000000001, 'LowerBand':68.11787745232472,'price':75.91,'BandWidth':0.32594104355896786, 'PercentB':0.29376250887276817,'date':'2005-04-28 16:00:00.000-0400'} - Copy as StreamBase Unit Test snippet with CSV
-
When used in the Output Streams view, the selected rows are copied to the clipboard wrapped in
Expectercode using the CSVTupleMaker, ready for pasting into an existing StreamBase JUnit file.new Expecter(server.getDequeuer("OutputIBM")).expect( CSVTupleMaker.MAKER, "IBM,94.6431225476753,81.38050000000001,68.11787745232472,75.91, 0.32594104355896786,0.29376250887276817,2005-04-28 16:00:00.000-0400" );When used in the Input Streams view, the selected rows are wrapped in a
getEnqueuer().enqueue()call using the CSVTupleMaker:server.getEnqueuer("InputStream1").enqueue( CSVTupleMaker.MAKER, "IBM,75.91,2005-04-28 16:00:00.000-0400" ); - Copy as StreamBase Unit Test snippet with JSON
-
Same as the previous option, but the generated code uses the JSONSingleQuotesTupleMaker. In the Output Streams view:
  new Expecter(server.getDequeuer("OutputIBM")).expect(
    JSONSingleQuotesTupleMaker.MAKER,
    "{'symbol':'IBM','UpperBand':94.6431225476753,'MiddleBand':81.38050000000001,
      'LowerBand':68.11787745232472,'price':75.91,'BandWidth':0.32594104355896786,
      'PercentB':0.29376250887276817,'date':'2005-04-28 16:00:00.000-0400'}"
  );
In the Input Streams view:
  server.getEnqueuer("InputStream1").enqueue(
    JSONSingleQuotesTupleMaker.MAKER,
      "{'symbol':'IBM','price':75.91,'date':'2005-04-28 16:00:00.000-0400'}"
  );
Use the Scroll Lock button in the view's toolbar to control how tuples scroll in the Output Streams table:
-
When Scroll Lock is off (the default): incoming tuple rows are added to the bottom of the table (or to the top of the table, depending on column sort order). The most recently received tuple is usually visible.
-
When Scroll Lock is on: the table display remains fixed on the currently selected tuple while new tuples arrive to fill the tuple buffer.
If the view's tuple buffer overflows, incoming tuples might begin scrolling again, even with Scroll Lock enabled. You can adjust the size of the view's tuple buffer as described in Preference Settings.
You can narrow the list of displayed tuples by matching a search string against field names or against the contents of the Fields column. You can elect to show only matching tuples, or to show all tuples but with color highlighting for the matching tuples.
Click the ![]() Filter button in the view's toolbar to open the Output Streams Filter dialog:
Filter button in the view's toolbar to open the Output Streams Filter dialog:
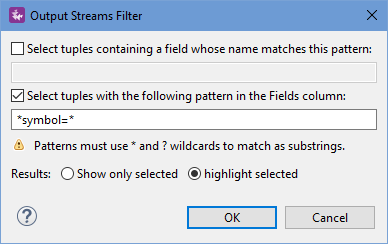 |
- Select tuples containing a field whose name matches this pattern
-
To match against a field name in tuples, check the Select tuples containing check box, and specify the name of a field. This option can be used, for example, when running an application with intermediate stream dequeuing enabled, where output from all incoming and intermediate streams is included. You can match against a field name to follow the progress of a particular field as tuples flow through various operators in your application.
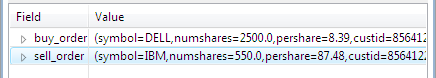
- Select tuples with the following pattern in the Fields column
-
Use this option to match against particular data values in tuples. The specified string is matched against the entire Fields column. This means you must specify wildcards before and after your search pattern in order to match your pattern as a substring. The example shown above matches the exact string
symbol=DELLin any tuple.
You can use one or both of the above options in the same filter. For example, you might match against a particular field name with the Select tuples containing option, and then match against particular data in that field using the Select tuples with option.
- Results: Show only selected
-
Select this option to narrow the list of tuples in the Output Streams view. Only the tuples matching the specified filter settings are shown.
- Results: highlight selected
-
Select this option to continue showing all tuples, but show any matching tuples with color highlighting, as illustrated in the first figure above. The default highlight color is yellow; you can adjust the highlight color in Studio Preferences.
Use the ![]() Create a new StreamBase Unit Test Class button to build an EventFlow Fragment Unit Test, which is a Java file based on the
Create a new StreamBase Unit Test Class button to build an EventFlow Fragment Unit Test, which is a Java file based on the org.junit and com.streambase.sb.unittest packages. See the unit test page more information.
Use the ![]() New Output Streams View button to create a copy of the currently selected Output Streams view.
New Output Streams View button to create a copy of the currently selected Output Streams view.
Use the ![]() Disable Dequeuing button to halt dequeuing from all streams in the currently running application. You might select this option, for example,
if you were optimizing the throughput of a test feed simulation in StreamBase Studio.
Disable Dequeuing button to halt dequeuing from all streams in the currently running application. You might select this option, for example,
if you were optimizing the throughput of a test feed simulation in StreamBase Studio.
When dequeuing is disabled, the grid of recent output tuples stops being populated, but is still active. You can still scroll and select any row to see individual output tuples in the details pane.
The following Studio preference settings affect the Output Streams view:
- Tuple Buffer Size
-
The default tuple buffer for the Output Streams view is 400 tuples. You can increase or decrease this value as required for your application and conditions.
- Highlight Color
-
The default highlight color for tuples matching a filter setting is yellow. Change the color with this preference setting.
You can open the Preferences page containing these settings in two ways:
-
Use the
 Menu button in the view's toolbar. The menu has a single item, Preferences, which directly opens the StreamBase Studio > Test/Debug page of the Preferences dialog.
-
In Studio's main menu, select > and open Test/Debug in the StreamBase Studio section.