Contents
The TIBCO StreamBase® Output Adapter for Velocity Analytics UTSS is an embedded StreamBase output adapter used to insert data into a user time series store (UTSS) via the Analytics Engine Firebird SQL interface. The adapter performs the following tasks:
-
Performs typechecking to ensure the incoming tuple schema matches the port schema.
-
Receives tuples from its preceding operator.
-
Prepares a SQL insert statement for each incoming tuple, accumulating the SQL statements until the batch size is reached.
-
Sends SQL statements to the Analytics Engine Firebird SQL server.
-
Reports back any error conditions.
-
Logs important events and error conditions.
Familiarity with the Thomson Reuters Enterprise Platform for Velocity Analytics is required. In addition, a Velocity Analytics development server environment is required with the following installed:
-
Analytics Engine
-
Broadcast Server
The following Velocity Analytics documentation, available on the Thomson Reuters Customer Zone, provides additional information about Velocity Analytics, its components, data formats, and the SQL interface to use to query the time series database and User Time Series Store (UTSS).
-
Installation Guide — provides instructions on installing Velocity Analytics components.
-
System Admin and Config Guide — provides additional information about data record formats.
-
Hardware and Software Guide — provides information about current hardware and operating system requirements.
-
Using SQL with Velocity Analytics — provides information about querying the Velocity Analytics time series bases and UTSS.
This section describes the properties you can set for this adapter, using the various tabs of the Properties view in StreamBase Studio.
Name: Use this required field to specify or change the name of this instance of this component, which must be unique in the current EventFlow module. The name must contain only alphabetic characters, numbers, and underscores, and no hyphens or other special characters. The first character must be alphabetic or an underscore.
Adapter: A read-only field that shows the formal name of the adapter.
Class name: Shows the fully qualified class name that implements the functionality of this adapter. If you need to reference this class name elsewhere in your application, you can right-click this field and select Copy from the context menu to place the full class name in the system clipboard.
Start with application: If this field is set to Yes (default) or to a module parameter that evaluates to true, this instance of this adapter starts as part of the JVM engine that runs this EventFlow module. If this field is set to
No or to a module parameter that evaluates to false, the adapter instance is loaded with the engine, but does not start until you send an sbadmin resume command, or until you start the component with StreamBase Manager.
Enable Error Output Port: Select this check box to add an Error Port to this component. In the EventFlow canvas, the Error Port shows as a red output port, always the last port for the component. See Using Error Ports to learn about Error Ports.
Description: Optionally enter text to briefly describe the component's purpose and function. In the EventFlow canvas, you can see the description by pressing Ctrl while the component's tooltip is displayed.
| Property | Description |
|---|---|
| Connect On Startup | When selected (default), the adapter automatically connects to the multicast when the StreamBase application is started. It
is recommended to enable Connect on Startup. Otherwise, make sure the control port is enabled so that a connect command can be issued.
|
| Enable Control Port | Enables the control port and status ports. See ControlStream for further information. The Status port is the last output port and is automatically enabled whenever the control port is enabled. |
| Enable Statistic Port | Enables the statistic port. See Statistics for further information. |
| Number of Input Ports | Set this to the number of data input ports configured via the Port Management tab; those are the ports that are mapped to flex record definitions. This number does not include the control, status, or statistics port. |
| JDBC URL | The JDBC connection string used to connect to the Analytics Engine Firebird SQL server. For a locally installed Analytics
Engine server, the string is of the form: jdbc:firebirdsql:where For a remote Analytics Engine server, the connection string takes this form: jdbc:firebirdsql://ae.example.com:3050/TRTCE?sql_dialect=3 |
| User Name | User name to be used to connect to the Firebird SQL server.
Example: |
| Password | Password for the above user.
Example: |
| UTSS Path | Path to the directory where the UTSS specified with UTSS Name resides.
Example: |
| UTSS Name | The UTSS database name used to store the analytics output. If the database does not exist, it is created on behalf of the
user.
Example: |
| Flex Record XML File | The name of the flex record configuration file imported to the application. This file must contain definitions corresponding to the records formats to be stored into the UTSS. It must match that used by the UTSS. This file is read whenever StreamBase typechecking is performed. |
| Log Level | Controls the level of verbosity the adapter uses to send notifications to the console. This setting can be higher than the containing application's log level. If set lower, the system log level is used. Available values, in increasing order of verbosity, are: OFF, ERROR, WARN, INFO, DEBUG, TRACE. |
This section describes the properties on the Advanced Properties tab in the Properties view for the Velocity Analytics UTSS output adapter.
| Property | Description |
|---|---|
| UTSS Recovery Log | Controls UTSS logging.
When enabled, all UTSS operations including insert, delete, and update are logged into a file along with data. Logging along with the UTSS database backup facility works in combination to provide UTSS database recovery in the event of a system or hardware failure. The default is disabled. See “UTSS Recovery” in Velocity Analytics Using SQL with Velocity Analytics for further details. |
| UTSS Compression Level | The compression level of the UTSS database. Levels include:
If not specified, compression level 0 is used. |
| UTSS Backup Interval | The length, in minutes, of the interval between automatic backup operations.
If not set, 0 is used, which means automatic backup is disabled. See “UTSS Recovery” in Using SQL with Velocity Analytics for further details about UTSS backup. |
| Batch Size | Allows the output adapter to perform SQL inserts in batch mode and sets the number of statements to be executed at one time. The default value is 1000. |
| Flush Interval | Expiration time, in milliseconds, from the last write operation after which a write operation is triggered. The default value is 10000. |
| Connections | Number of SQL connections opened. The default value is 1. |
| Reconnect Interval | The time interval, in milliseconds, after which the validity of the connection to the Analytics Engine is checked and a reconnection is attempted, if the connection is invalid. The default value is 1000. |
| Connection Retries | The maximum number of consecutive connection retries that can be performed. When this number is reached, the adapter stops connection retries. The default value is –1, meaning unlimited. |
| Statistics Interval | Time interval, in milliseconds, between two consecutive statistics outputs. The default value is 5000 ms. The statistics port must be enabled in order to see output.
|
This section describes the Port Management tab in the Properties view for the Velocity Analytics UTSS output adapter.
This tab is used the same way as the Port Management tab for the Velocity Analytics Broadcast Server Input adapter, described on this page.
The Port Management tab takes the form of a Port to Flex Record Mapping grid where you enter one port#=FRDef entry per line, with each line corresponding to an input port for this adapter instance. Examples:
port0=Trade |
port1=Quote |
For this adapter, it is recommended to keep Multiplicity set at single; otherwise, time series order of the data written to the UTSS is lost.
Use the Concurrency tab to specify parallel regions for this instance of this component, or multiplicity options, or both. The Concurrency tab settings are described in Concurrency Options, and dispatch styles are described in Dispatch Styles.
Caution
Concurrency settings are not suitable for every application, and using these settings requires a thorough analysis of your application. For details, see Execution Order and Concurrency, which includes important guidelines for using the concurrency options.
This section demonstrates how to use the Broadcast Input adapter within a StreamBase application and describes the use of the adapter's ports. As shown in the EventFlow diagram below (from this adapter's sample application), the adapter uses two input ports and three output ports to communicate with the surrounding application. As with other StreamBase adapters and operators, you can optionally enable an Error Output Port.
This section demonstrates how to use the Velocity Analytics UTSS Output adapter in a StreamBase application, and describes the use of the adapter's ports. By default, the adapter provides one input port. As shown in the EventFlow diagram below (from one of this adapter's sample applications), the adapter can communicate with the surrounding application by means of a configurable number of input ports, plus optional statistics and status output ports. As with other StreamBase adapters and operators, you can optionally enable an Error Output Port.
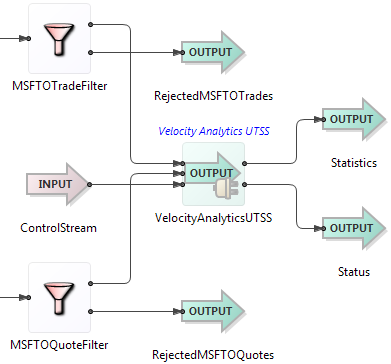 |
The Velocity Analytics UTSS output adapter's ports are used as follows:
-
ControlStream (input): The optional input stream used to control the adapter during runtime. The adapter can be configured to have a control input port and corresponding status output port through the Enable Control Port check box in the Adapter Properties section of the Properties view. When enabled, they are represented as the last input and output port nodes on the adapter icon. The control port must have a schema consisting of a single field named
commandof typestring. The following commands can be sent to the Control port to manage the adapter during runtime or to generate a status report. Commands are case insensitive.connectConnect to the Analytics Engine and start writing data. disconnectDisconnect from the Analytics Engine and shut down all processing threads. reconnectReconnect to the Analytics Engine and start writing data. enableportNumEnable portNumto receive data when available. When the adapter is started, all data input ports are enabled by default. The changed setting persists after a disconnect. Use this form of theenablecommand to control an individual port.enableflexDefNameEnable flexDefNameto emit data when available. When the adapter is started, all data input ports are enabled by default. The changed setting persists after a disconnect. The adapter supports multiple ports to same flex record definition mapping to support users that may want to write data from different Analytics Engines to the same flex record definition. So, when the commandenableis sent, all ports mapped toflexDefNameflexDefNameare affected. Useenableto control an individual port.portNumdisableportNumDisable portNumfrom emitting data when available. When the adapter is started, all data input ports are enabled by default. The changed setting persists after a disconnect.disableflexDefNameDisable flexDefNamefrom emitting data when available. When the adapter is started, all data input ports are enabled by default. The changed setting persists after a disconnect.statusEmit status of the ports and the connection to the status port. The status port must be connected to an output stream to see its output. -
Data (input): An input stream representing tuples arriving from upstream applications. These tuples have a record format as defined in the Port Management tab and corresponds to a flex record definition supplied to the adapter.
-
Statistics (output): The optional output stream that carries various adapter statistic counters. The counters in the table below are available through the statistics port of the adapter. The statistics port can be enabled or disabled via the Enable Statistics Port check box in the Adapter Properties tab of the Properties view.
TotalSQLStatementsTotal number of SQL statements received for writing. RejectedSQLStatementsThe number of SQL statements received but rejected by the adapter because it is not ready to process the data. This can happen when reconnection to the Analytics Engine is in progress or is disconnected. FailedSQLWritesTotal number of statements not written successfully. PreparedStatementQueueSizeCurrent size of the prepared statement queue. -
Status (output): The optional output stream carrying adapter status.
Add an instance of the adapter to a new EventFlow application as follows:
-
In StreamBase Studio, create a project, including an empty StreamBase EventFlow application file to host the adapter.
-
Insert the adapter into your application. Drag the Output Adapter icon from the Operators and Adapters tray of the Palette view. In the resulting dialog, type
velocityto narrow the list of options, then select Velocity Analytics UTSS from the Global Output Adapters section. (As an alternative, you can invoke → from top-level menu to invoke the same dialog.) -
Configure the adapter via its various properties tabs. See Setting Properties for further information.
-
Import the flex record definitions file corresponding to the flex records multicast to the adapter.
-
Connect Input Streams to the adapter's input ports corresponding to input port properties.
-
Enable the Statistics Port, if desired. See Statistics for information.
-
Enable the Control and Status Ports. See ControlStream for further information. If the Control port is not enabled, make sure Connect On Startup is enabled via the Adapter Properties tab; otherwise, there is no way to inform the adapter to establish connection with the Analytics Engine.
-
Make sure the Velocity Analytics Engine is started on the machine hosting the UTSS database, and that flex record definitions corresponding to UTSS record formats are loaded.
-
Run the EventFlow application by clicking the button in the Studio toolbar.
-
Use the Velocity Analytics user interface to query the newly written records.
-
Before stopping the EventFlow application, issue a
disconnectcommand via the Control port. This insures all buffered data is processed before the application shuts down.
The adapter uses the logging facility provided by StreamBase, which provides built-in support for standard loggers such as Log4J and Logback. See Using StreamBase Logging in the Administration Guide.
Logging is controlled through the XML configuration file, logback.xml. Using this configuration file, you can customize logging based on your needs. For example, you can change the log message
format, include or remove timestamps, and so on. The logging level for the individual adapter messages can be set through
the Log Level drop-down control in the Adapter Properties section of the Properties view.
The adapter uses typechecking messages to help you configure the adapter in your StreamBase application. In particular, the adapter generates typecheck messages for the following reasons:
-
The
VhayuRecordDefinition.xmlfile is not found. -
Values in the Properties view tabs are invalid.
-
The flex record definition used in a port mapping is not found in the
VhayuRecordDefinitions.xmlfile. -
The schema of the Control port is wrong. It must have a single field named
commandof typestring. -
The number of ports specified is more than the number of ports configured in the Port Management tab.
-
The
SYMBOLfield is missing from the list of fields for any port definitions that list specific fields. -
An incoming input field name is not in the list of field names for the flex record definition mapped to the port.
-
A mismatched type for the
commonfield.
The adapter generates messages during runtime under various conditions, including:
-
Any connection error to the Analytics Engine that could be due to the wrong IP address, the Analytics Engine being down, a network error, and so on.
-
Out of Memory error due to an increase in the internal buffer size. This could be because the incoming data rate is higher than the rate at which data is written to UTSS. This can be monitored using the
PreparedStatementQueueSizecounter in the statistics port output. If its value continues to increase, this indicates a problem. Increasing the Connections setting via the Advanced Properties tab may help to resolve the issue.
When suspended, the adapter stops writing to the UTSS archive, and stops emitting Status and Statistics tuples, if enabled. All new incoming records from the upstream component in the EventFlow are discarded without any processing. The records that have already been processed by the adapter but were not written to the UTSS archive are cached.
On resumption, the adapter resumes writing to the UTSS, and resumes emitting Status and Statistics tuples, if enabled. New records are received and processed normally. Records that were cached on suspension are written to the UTSS archive before any new records are processed.
The custom functions described in this section are available in the following classes:
com.thomsonreuters.sb.adapter.velocityanalytics.broadcastserver.Utility |
com.thomsonreuters.sb.adapter.velocityanalytics.utss.Utility |
These classes are provided as part of the JAR files that implement the Velocity Analytics adapters. See the Velocity Analytics Samples for examples of calling these functions with the StreamBase expression language's calljava() function.
The following sections list the available time conversion functions based on the source time format. In all instances, time parameters are defined as:
asciiTime |
The string representation of a date/time, expressed with the following format: yyyymmddhhmmss[.tttttt][-timezone].
|
sbTime |
StreamBase proprietary time format. |
serialTime |
UTC time expressed with the ISO C standard time_t type definition. It is the number of seconds since Jan 1, 1970, 00:00:00 (midnight). |
vhTime |
Velocity Analytics proprietary time format. This is UTC time expressed by the number of tenths of a microsecond (100ns) since
Jan 1, 1601, 00:00:00.000,000,0 (midnight). To convert from serial time to VHTime, use the following formula: (time_t * 10000000) + 116444736000000000 |
| Destination Time Format | Function |
|---|---|
| ASCII Time | String toGMTAscii(String
|
| StreamBase Time | Timestamp asciiTimeToSBTimestamp(String |
| VH Time | long asciiTimeToVH(String |
| Serial Time | int asciiTimeToSerial(String |
| Destination Time Format | Function |
|---|---|
| ASCII Time | String sbTimestampToLocalAscii(Timestamp
|
| StreamBase Time | N/A |
| VH Time | long sbTimestampToVH(Timestamp |
| Serial Time | int sbTimestampToSerial(Timestamp |
| Destination Time Format | Function |
|---|---|
| ASCII Time | String vhTimeToLocalAscii(long
|
| StreamBase Time | Timestamp vhTimeToSBTimestamp(long |
| VH Time | N/A |
| Serial Time | int vhTimeToSerial (long |