This topic explains how to use the Decision Table Analyzer, which you use to analyze the rules file currently loaded in the Decision Table Editor.
Use the Table Analyzer to examine .sbdt format decision table files to report logic problems with the specified rules, such as different sets of actions for identical
conditions. The Table Analyzer validates decision tables by checking them at design time. You can also use the Table Analyzer's
Show Coverage feature to simulate an incoming tuple to see how the current rules file handles the fields in that tuple.
Design time validation consists of:
-
Expression validation
-
This validates whether expressions in the Condition or Action columns are valid.
-
Invalid expressions are marked as errors.
-
-
Condition validation
-
This validates whether the expression can represent a meaningful condition.
-
Any expression that eventually evaluates to "always true" or "always false" is considered invalid.
Simple example 1: > 10 && < 5, is always false no matter what the incoming data is.
Simple example 2: > 50 || < 100 is always true no matter what the incoming data is.
The Table Analyzer is able to detect more complex expressions such as: (> 100 || < 50) && (>60 && < 80).
-
Rule analysis consists of:
-
Overlap: rules that have overlapping region. A region covered by both rules is reported.
-
For example, given two rules (conditions are merged for convenience): rule1: (i >10 && i <= 20) && (j > 100 && j < 200), rule2: (i > 15) && (j < 150), then the overlapping region (i > 15 && i <= 20) && (j > 100 && j < 150) is reported.
-
-
Duplication: rules that have same conditions and actions. This is a special case of overlap.
-
Even when conditions are different literally, as long as they evaluate to the same, semantically, the Analyzer reports them as duplicates.
-
Simple example: (> 10 && <= 200) and (>10 && < 200 || 200) will be reported as duplicates, if they are the only condition in each rule.
-
-
Ambiguity: rules have same conditions but different actions.
-
Superset: one rule's region completely covers another rule's region. This is also a special case of overlap.
To use the Table Analyzer, do the following:
-
Open an
.sbdtdecision table on the Studio canvas and make sure the Table Analyzer tab is active.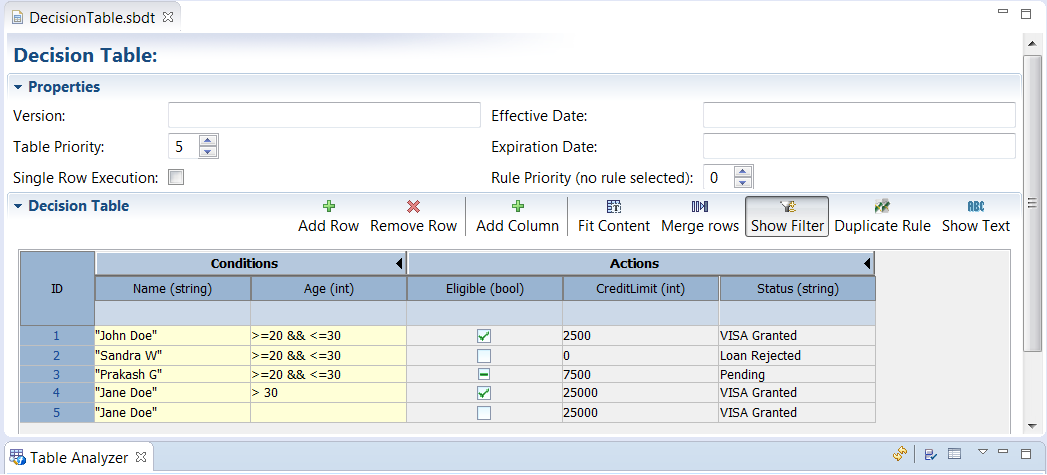
-
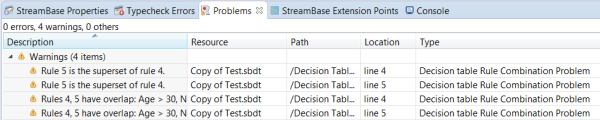
Click the
 button. A message appears indicating whether rules are valid. The Table Analyzer displays invalid rules in the Problems view, including a description, the decision table file name, project folder, problem source, and problem type.
Rules will run regardless of whether warnings appear in the Problems tab. In addition to those described previously, another useful Table Analyzer feature to troubleshoot rule issues or encourage rule creation best practice is . Show Coverage highlights rules that share predicates in common, based on rule creation. This is particularly useful to eliminate duplication, especially when editing large rule sets.
In the example below, two conditions and their ranges or values appear in the Table Analyzer, Age and Name. Adjust the upper
and lower Age ranges (by adjusting the slider or entering values), select Names and click the ![]() button to display the result. Four rules, highlighted in green, meet the selected criteria.
button to display the result. Four rules, highlighted in green, meet the selected criteria.
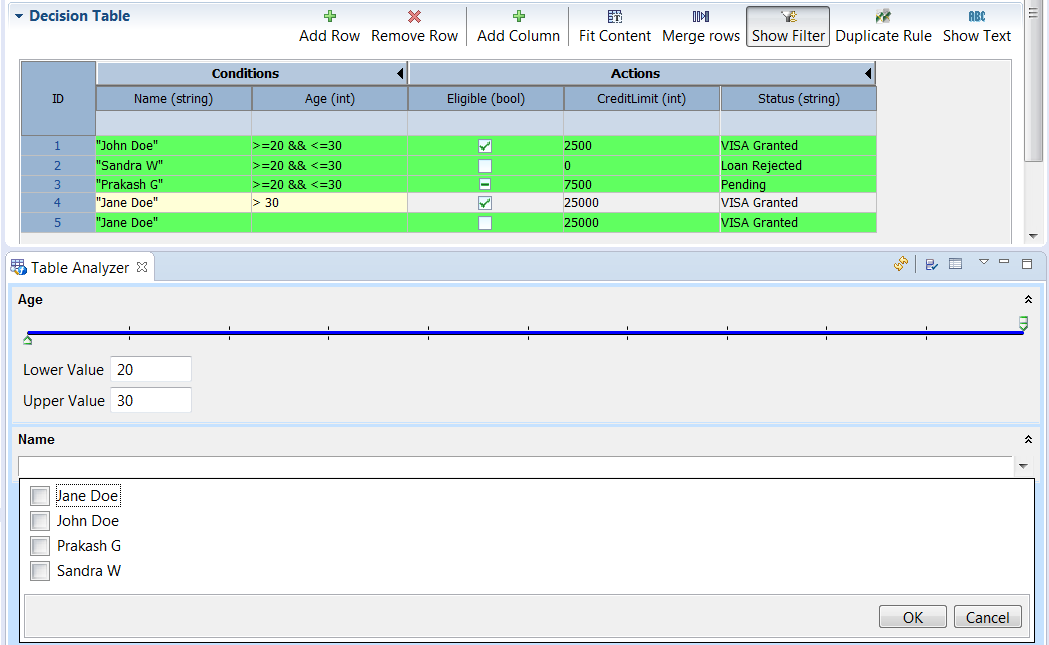 |
The Decision Table's Show Coverage tool highlights the decision table rows that meet all the criteria you specify in the Table Analyzer view.
The coverage analyzer does NOT consider StreamBase expression columns in performing its (static) analysis, since these cells potentially contain references to input tuple fields, whose (dynamic) content is not known until run time. Thus, these columns are "don't cares", even though they may contain content.
Note
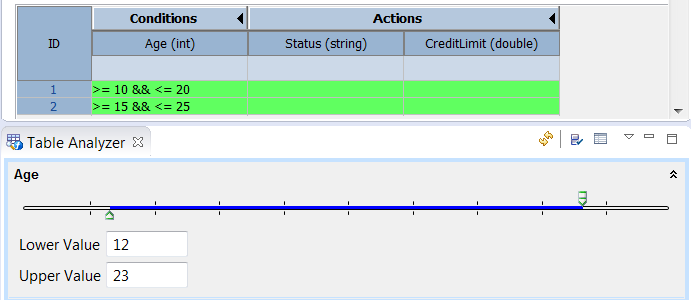
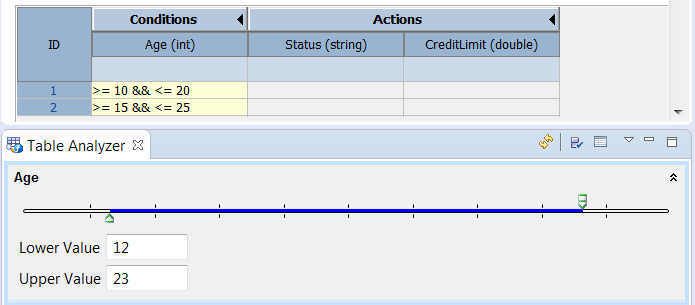
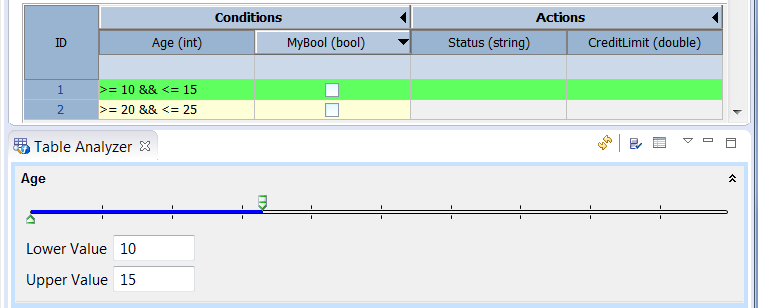
The preference (see Decision Table — Analyzer Panel) determines whether rows whose condition falls completely or partially within the specified condition range are highlighted.
The following two images show the coverage with and without the Highlight Partial Ranges preference enabled:
 |
 |
Before performing a new coverage analysis, you MUST save the decision table and click the button (circled in the image below):
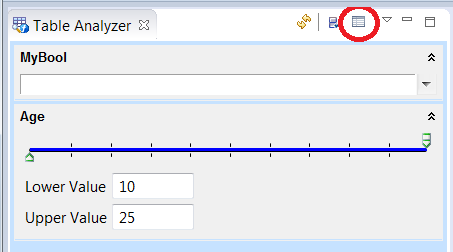 |
The criteria for a column is present only if at least one decision table cell in that column has a value. Thus, in the image below, there is no criteria for MyBool, because all the cells in that column are empty (neither true nor false). Also, the Table Analyzer can provide false as an option if all cells in a boolean column set to true, and vice versa.
 |
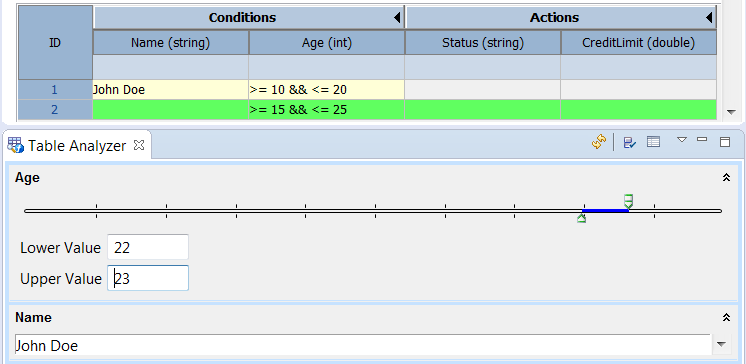
Empty cells in the decision table are "don't cares" and match any criteria for that column. Thus, in the image below, the second row is highlighted, because it matches the age criteria specified. Its Name cell is empty, which matches John Doe (or any other name).
 |