Contents
The SB Trace Debugger perspective in StreamBase Studio provides a way to review and analyze runtime trace files generated while an application was running. You can load and analyze trace files any time after the application has stopped.
Trace debugging is a way to study an application's behavior offline by stepping through a trace file, line by line. The file contains rows of tuple values in the order they were processed, and shows you how they change, stream by stream. If your application is open in Studio, then when you step through a trace, the location of each line you select in the trace debugger is automatically highlighted in the associated EventFlow module.
Note
Unlike regular debugging, which you do while running in Debug mode, enabling trace debugging generates a trace file of input, output, and intermediate tuples when you execute your application with → . You then send data to the application. When you stop the application, you view the file's contents in the SB Trace Debugger perspective.
You can generate trace files for this purpose in two ways:
-
Enable trace file generation for your application as described in Runtime Tracing and Creating Trace Files. When you run your application, either provide it with test data in a feed simulation, or run it with live data. When the application stops, switch to the SB Trace Debugger perspective and open the generated trace file.
-
Launch your application in Studio in Trace Debug mode.
Trace Debug mode is a third launch mode for running applications in Studio, in addition to Run and Debug modes. To run In Trace mode:
-
Start with your application's EventFlow, StreamSQL, or Deployment File Editor open, with the application typechecked and free of errors. It is best to have a feed simulation prepared and ready to run.
-
Click the
 Trace Debugger button in the Studio toolbar, or select → → .
-
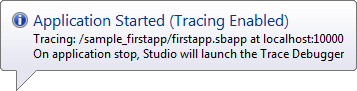
Studio runs the application normally and automatically starts recording a trace file for the main application in the default container. The status button in the lower left corner of the Studio window shows a message like the following:
-
Send tuples to the application manually or with a feed simulation.
-
When you stop the application, Studio automatically switches to the SB Trace Debugger perspective, with the newly-recorded trace file already loaded. You can now use this perspective to follow the progress of a single tuple through your application.
You can edit and save Trace Debugger launch configurations in the same way as Run and Debug launch configurations. For more information, see Editing Launch Configurations.
When you open the SB Trace Debugger perspective, you see its Query View with your most recent trace file preloaded. You can select different trace files using the button, reopen the current file by clicking , or close the file and remove all trace display window tabs that you have created when tracing by clicking . The Query View is shown in the following illustration:
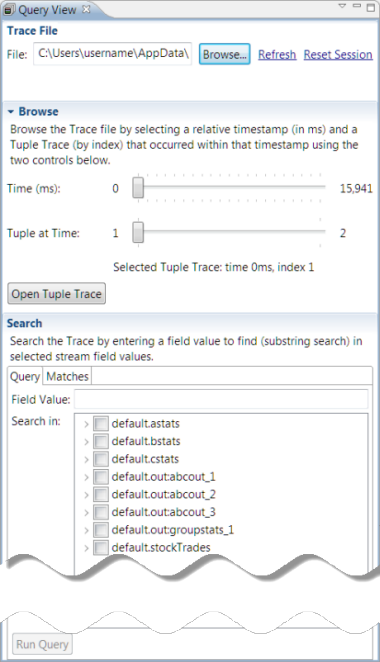
The Query view lets you:
-
Navigate to and open a trace file using the Trace File pane. If you have just performed a trace, its file automatically opens when you stop the application.
-
Browse the currently open trace file using the Browse pane. Set the timestamp index slider to view the contents of tuples emitted in the time frame indicated. The default is the first tuple in the file.
Click to open a view in which you can trace the path of that tuple through the application.
-
Use the Search pane to search the trace file for a particular field value. The value you specify is a string, not an expression, and it can occur in any tuple field. (The trace file is a CSV file that does not specify data types, so there is no typechecking.)
When you select at the bottom of the pane, you see a list of the tuples that match your query in the Matches tab of that pane.
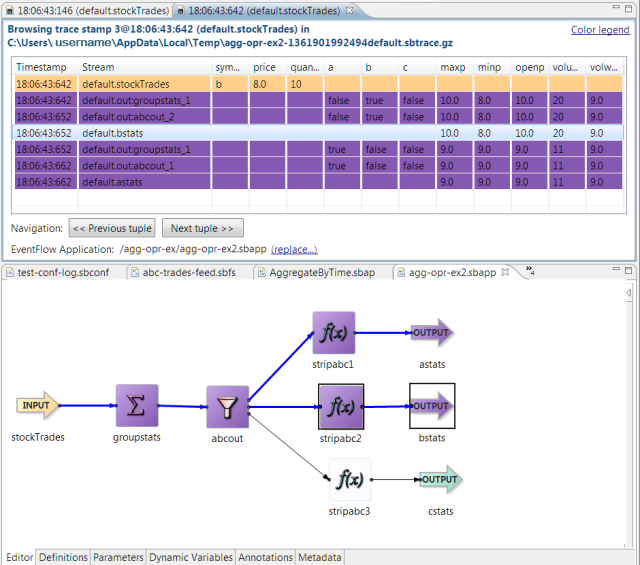
When you Click , you see a representation of tuples for the time frame in the trace results window as a grid of color-coded values. Here is an example of tuples displayed in that window.
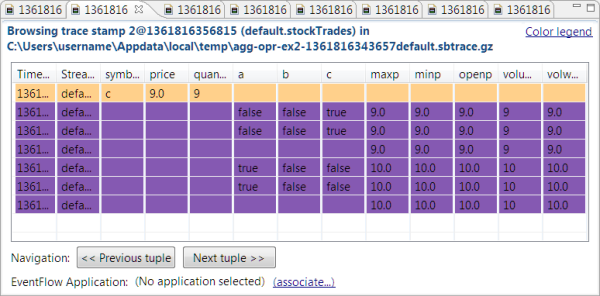
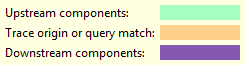
The button on the top right of the display panel describes the color coding for the tuples:
Step through input tuples in the file backward and forward with the and buttons, respectively.
Click a row of tuples to select it, or Shift+click to select a range of rows. To copy the selection to the clipboard, right-click and select . When you select rows, the locations that they map to in your application are highlighted, as shown below:
Unless you have changed configuration settings (as described in Setting Up for Runtime Tracing), StreamBase Studio is pre-configured for trace debugging. The default location for your trace files is your system's default
temporary directory (normally C:\Users\ on Windows or username\AppData\local\temp/tmp on Linux and UNIX). However, you can specify a location for trace files by selecting , clicking the tab, enabling the button under Persistent Data Options and typing or browsing to a path naming the desired location.
If you are reviewing a trace from a prior session, to enable highlighting of operators, data constructs, and adapters as shown above, you must associate the trace file with the EventFlow application that created it. To do that, click the button under the navigation buttons in the trace data display window and select the application that was traced from those in your workspace.
Trace files are created in pairs, with the data in a .gz archive and schema information in an .sbtrace-meta XML file. Trace file names take the form application-name-timestampcontainer-name.sbtrace.gz.sbtrace-meta extension.
Trace files persist until you manually delete them. Because they can grow quite large for complex applications, especially when run at high data rates, be sure to monitor the contents of your trace file folder and delete files you no longer need.
You can limit the size of trace files and save time when analyzing them by restricting their scope. If you are only interested in debugging certain operators and streams, you can restrict runtime tracing to only include them. Do this by specifying a regular expression in the Advanced tab of the Trace Configurations dialog. Select , and enter the expression in the text box next to it. Use a regular expression to be parsed by java.util.regex.Pattern.
For example, if you are interested only in tuples that end up at one of several output streams, you can insert the name of
that operator in the text field labeled . Open the StreamBase sample BestBidsAsk.sbapp and in the field, enter BestBids to trace only tuples that represent bids, not asks. Click , and run with the NYSE.sbfs feed simulation. When you stop BestBidsAsks, the SB Trace Debugger perspective displays only tuples arriving at the BestBids
output stream.
The Search pane in a Query view can also restrict what tuples the Trace Debugger displays. When analyzing a trace file, you can narrow the view to only those tuples that arrive at certain operators with a value that you specify. The value match is applied to all fields unless you limit the match to specific fields; to do this, click the arrow control next to the operator names of interest in the Query pane, and clear the check box for the fields you want to exclude.
Search terms are simple strings. Matching values may include substrings containing the search term. Thus, searching for 4.0 will also find values of 14.0, 4.05, and so on.