Contents
This sample demonstrates the use of the Spotfire Streaming Correlations operator.
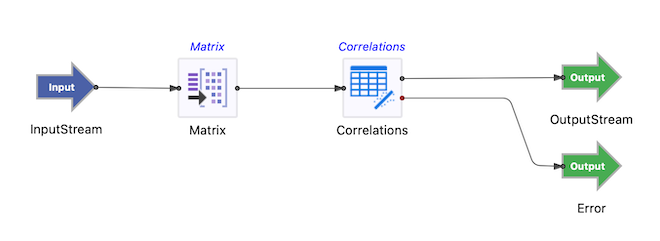
The provided StreamBase module uses randomly generated data with three variables as inputs. The data has been simulated such that the correlation between variables X1 and X3 evolve over time from a strong positive correlation to a strong negative correlation. The matrix operator is used to emit data as a sliding window with 100 observations in each window.
 |
In StreamBase Studio, import this sample with the following steps:
-
From the top-level menu, click >.
-
In the search field, type
correlationto narrow the list of options. -
Select Calculate the correlation coefficient from the Streaming Datascience Operators category.
-
Click .
StreamBase Studio creates a single project containing the sample files.
-
In the Project Explorer view, expand the
sample_datascience_correlationproject and double-click to open theCorrelation.sbappapplication. Make sure the application is the currently active tab in the EventFlow Editor. -
Click the Run button. This opens the SB Test/Debug perspective and starts the application.
-
Click on the Feed Simulations tab, click the
Correlation.sbfs, then click the Run button to start feeding the data. -
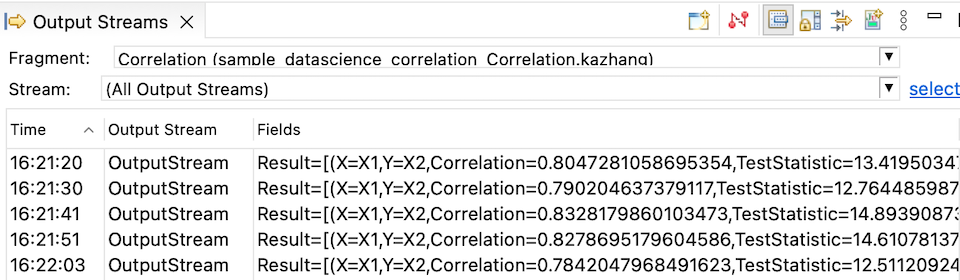
The Correlations operator starts taking data from the feed simulation, testing the correlations between X1, X2 and X3.
-
When done, press F9 or click the Stop Running Application button.