
Contents
The SB Trace Debugger perspective in StreamBase Studio provides a way to review and analyze runtime trace files generated while an application was running. You can load and analyze trace files any time after the application has stopped.
Trace debugging is a way to study an application's behavior offline by stepping through a trace file, line by line. The file contains rows of tuple values in the order they were processed, and shows you how they change, stream by stream. If your application is open in Studio, then when you step through a trace, the location of each line you select in the trace debugger is automatically highlighted in the associated EventFlow module.
Note
Unlike regular debugging, which you do while running in Debug mode, enabling trace debugging generates a trace file of input, output, and intermediate tuples when you run your application with >. You then send data to the application. When you stop the application, you view the file's contents in the SB Trace Debugger perspective.
You can generate trace files for this purpose in two ways:
-
Enable trace file generation for your application as described in Interpreting Trace Files. When you run your application, either provide it with test data in a feed simulation, or run it with live data. When the application stops, switch to the SB Trace Debugger perspective and open the generated trace file.
-
Launch your application in Studio in Trace Debug mode.
Trace Debug mode is a third launch mode for running applications in Studio, in addition to Run and Debug modes. To run In Trace mode:
-
Start with your module's EventFlow Editor open, with the module typechecked and free of errors. It is best to have a feed simulation prepared and ready to run.
-
Click the
 Trace Debugger button in the Studio toolbar, or select >>.
-
Studio runs the fragment normally and automatically starts recording a trace file for the main application in the default container.
-
Send tuples to the application manually or with a feed simulation.
-
When you stop the application, Studio prompts you to automatically switch to the SB Trace Debugger perspective with the newly-recorded trace file already loaded. You can now use this perspective to follow the progress of a single tuple through your application.
You can edit and save Trace Debugger launch configurations in the same way as Run and Debug launch configurations. For more information, see Editing Launch Configurations.
When you open the SB Trace Debugger perspective, you see its Query View with your most recent trace file preloaded. You can select different trace files using either the or the button, reload the current file by clicking , or close the file and remove all trace display window tabs that you have created when tracing by clicking . The Query View is shown in the following illustration:
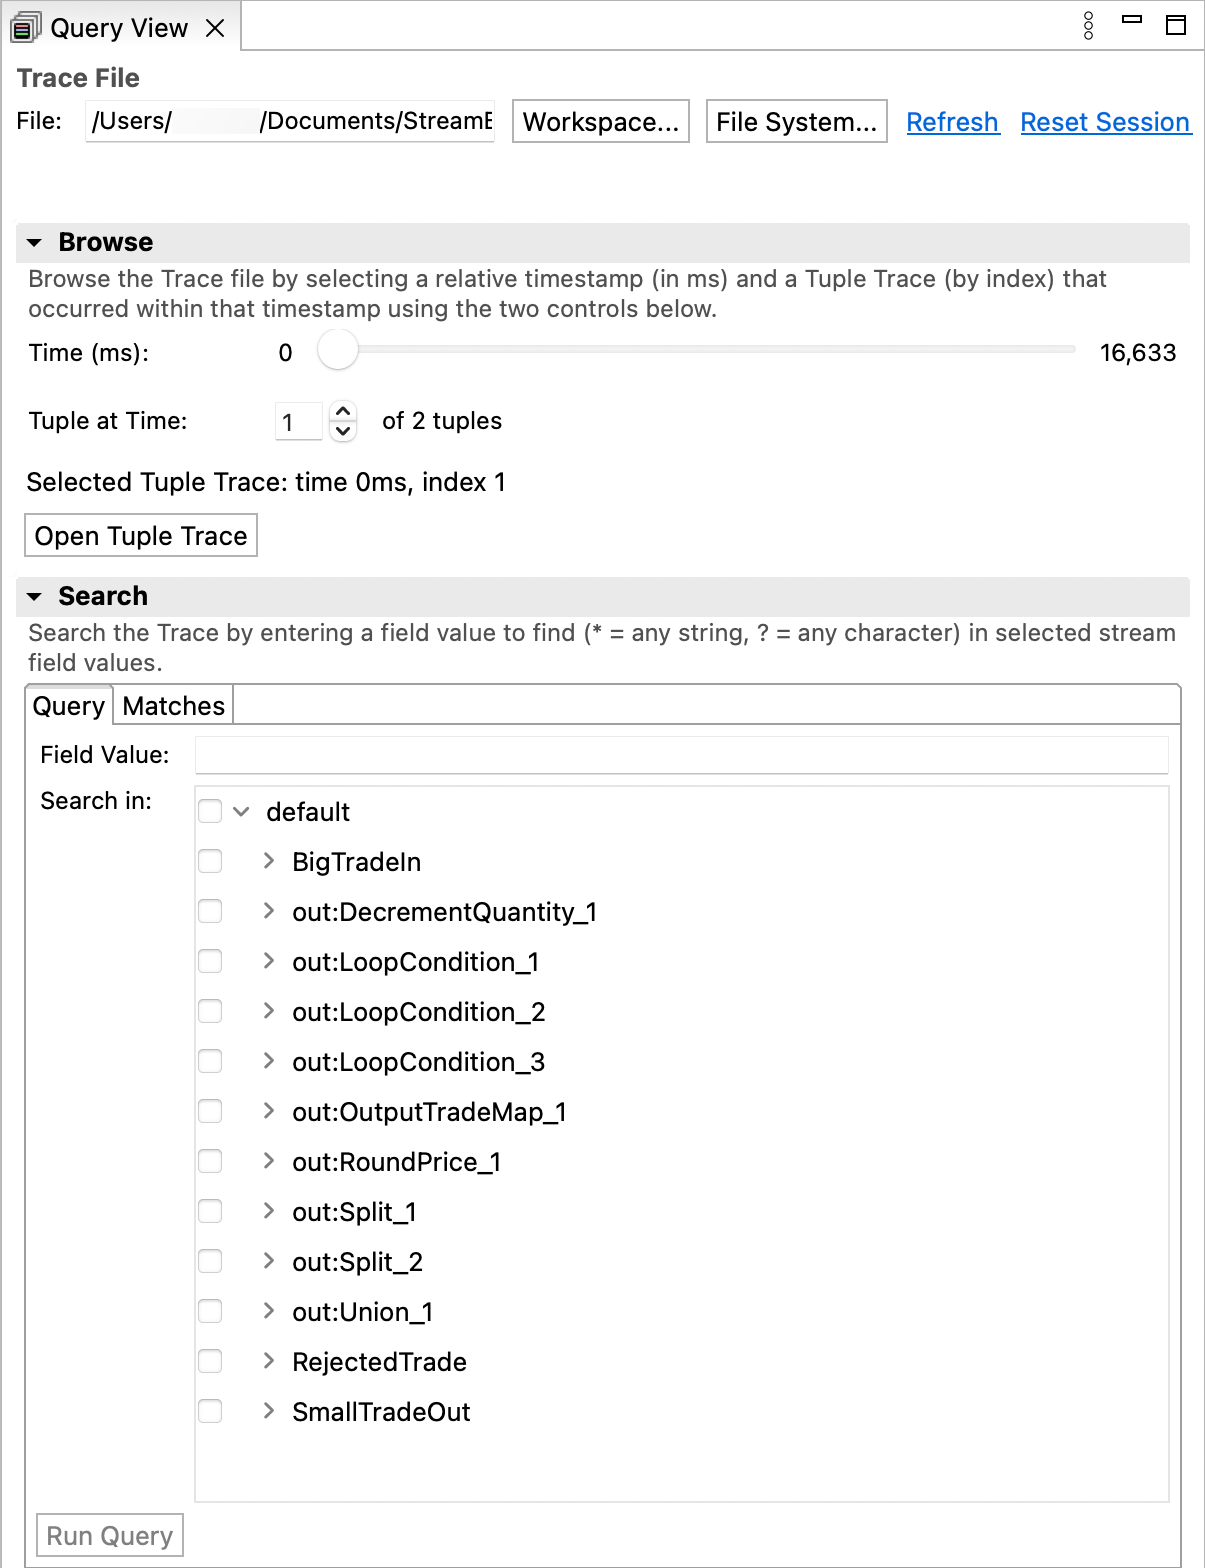 |
The Query view lets you:
-
Navigate to and open a trace file using the Trace File pane. If you have just performed a trace, its file automatically opens when you stop the launch.
-
Browse the currently open trace file using the Browse pane. Set the timestamp slider to view the contents of tuples emitted in the time frame indicated. The default is the first tuple in the file. If there was more than one tuple emitted in the selected time frame, you can use the spinner to select a tuple index.
Click to open a view in which you can trace the path of that tuple through the application.
-
Use the Search pane to search the trace file for a particular field value. The value you specify is a string, not an expression, and it can occur in any tuple field. (The trace file is a CSV file that does not specify data types, so there is no typechecking.) You can narrow the search to specific fields by selected them in the tree below the search box. Note than an entire module or stream can also be selected to search in all of its fields.
When you select at the bottom of the pane, you see a list of the tuples that match your query in the Matches tab of that pane.
When you Click , you see a representation of tuples for the time frame in the trace results window as a grid of color-coded values. Here is an example of tuples displayed in that window.
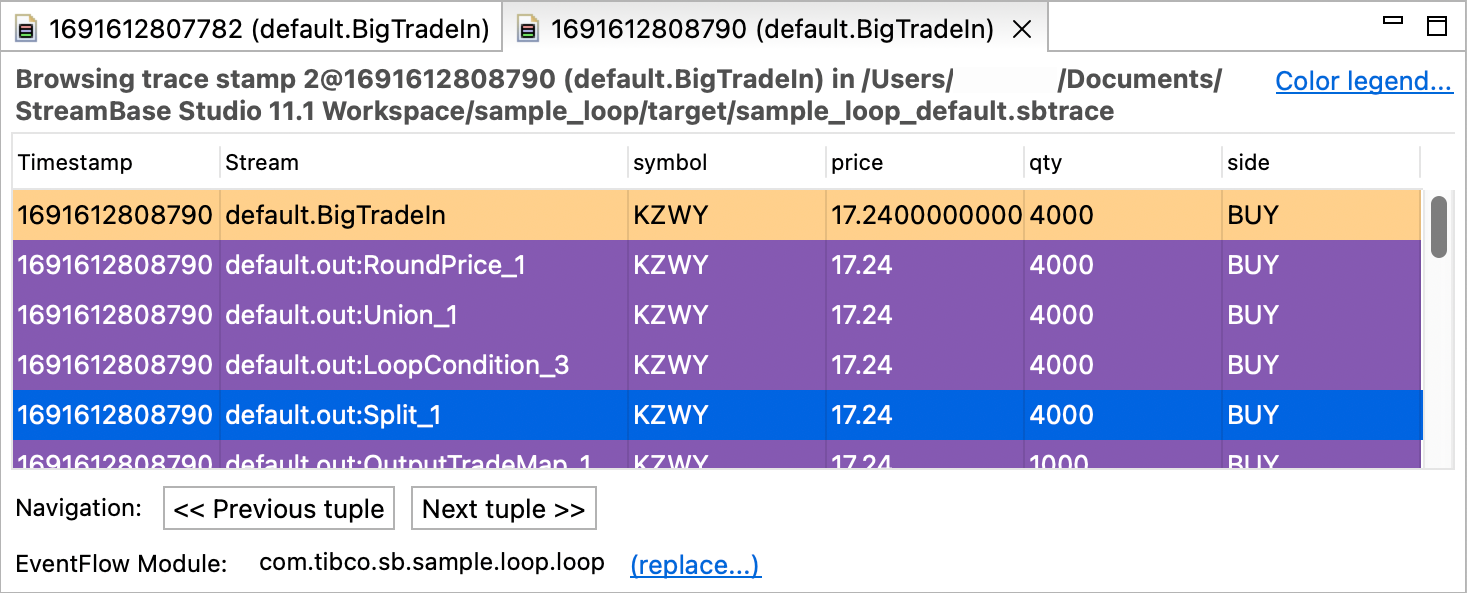 |
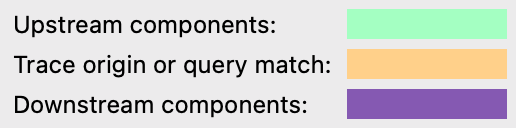
The button on the top right of the display panel describes the color coding for the tuples:
 |
Step through input tuples in the file backward and forward with the and buttons, respectively.
Click a row of tuples to select it, or Shift+click to select a range of rows. To copy the selection to the clipboard, right-click and select . When you select a row, the locations that they map to in your application are highlighted, as shown below:
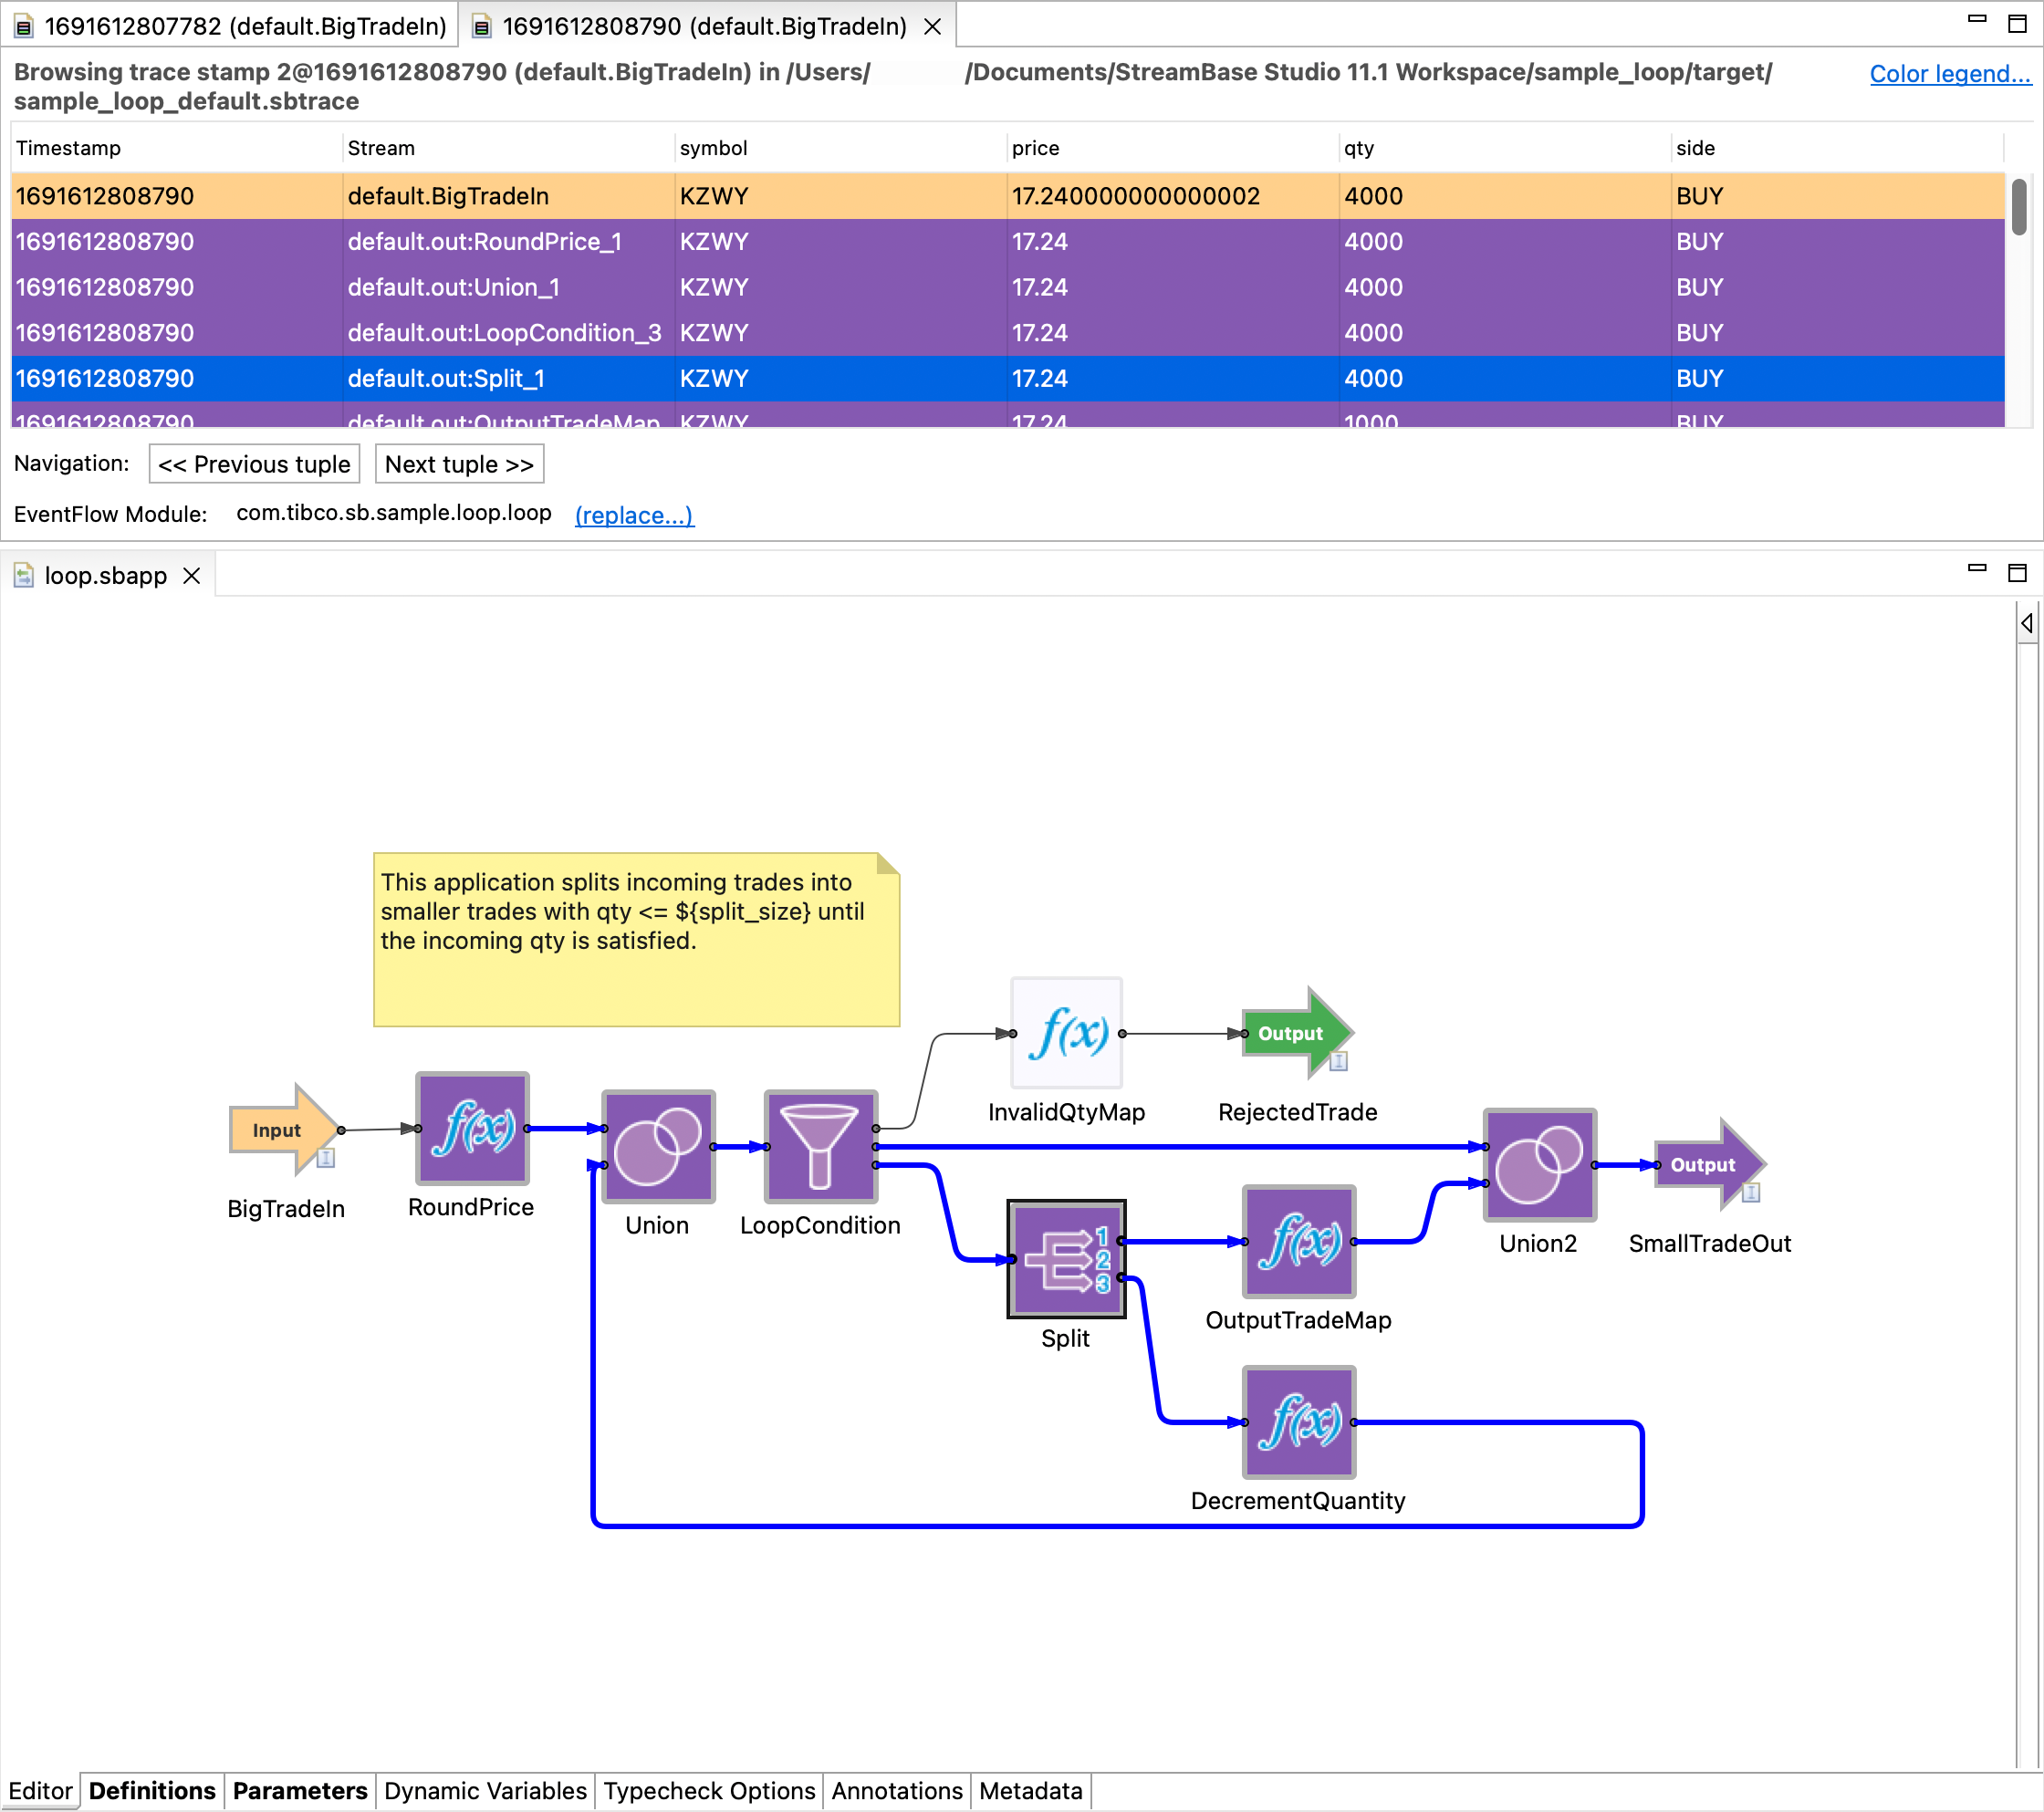 |
If the selected row corresponds to a tuple in another module (such as via a Module Reference operator), the EventFlow file for that module will be opened and highlighted as above. If the selected module is not available, a blank editor will open saying Source not available. This happens if a Module Reference or Extension Point operator points to a module that is not in your workspace (such as in your local Maven repository via a dependency).
Unless you have changed configuration settings (as described in Interpreting Trace Files), StreamBase Studio is pre-configured for trace debugging:
-
The default location for your trace files is your project's output directory (normally
project_name/target -
Tracing is enabled for the default container.
Additional tracing options can be configured in an EventFlowDeployment configuration file.
If you are reviewing a trace from a prior session, to enable highlighting of operators, data constructs, and adapters as shown above, you must associate the trace file with the EventFlow module that created it. To do that, click the button under the navigation buttons in the trace data display window and select the module that was traced from those in your workspace.
Trace files are created in pairs, with schema information in an .sbtrace-meta XML file and the data in an .sbtrace file. Trace file names take the form module_name-container_name.sbtrace.gz if compression is enabled). The associated metadata file name uses the same basename with the .sbtrace-meta extension.
If launching with a Trace Configuration in Studio, a preexisting trace file will be truncated before launch, otherwise new data is added at the end of the file. Because they can grow quite large for complex applications, especially when run at high data rates, be sure to monitor the contents of your trace file folder and delete files you no longer need.