Contents
The StreamBase Studio EventFlow Debugger allows you to see what is going on inside your StreamBase application by inspecting the incremental processing of tuple data. You can suspend a StreamBase application at specified breakpoints, display tuple contents after every operator, and step into and out of modules. If you have used program debuggers before, the EventFlow Debugger's commands and options will be familiar.
The EventFlow Debugger can be used to debug EventFlow application modules and related Java code (such as in custom Java operators). It is an interactive inspection facility and is not for general monitoring or use as a trace debugger for diagnosing server behavior. It is only available within a StreamBase Studio session and is not accessible through the StreamBase Client API.
The EventFlow Debugger is based on the Eclipse Debug Framework (EDF), and is accessed through the SB Test/Debug perspective. Studio re-uses the Eclipse EDF's Debug, Variables, and Breakpoint views. Because the EventFlow Debugger inherits from a Java code debugger, many of its features do not apply to EventFlow debugging. You can learn about the basic EventFlow Debugger features and operations in the Java Development User Guide that is included in the Studio help system. Navigate to > in that guide. On the Web, you can find the same documentation at eclipse.org.
Initiate an EventFlow Debugger session as follows:
-
Start in the SB Authoring perspective.
-
Select the EventFlow module of interest in the Project Explorer view and open it in the EventFlow Editor.
-
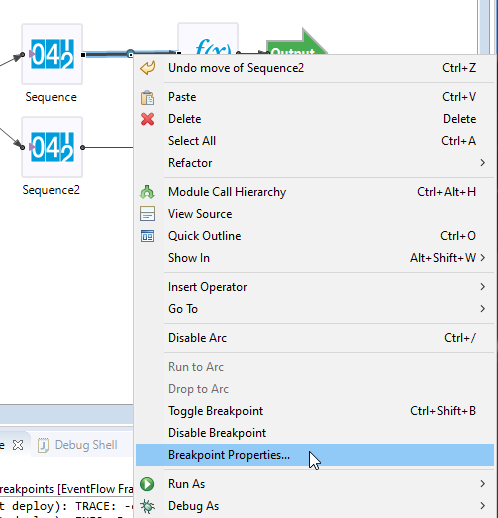
Set breakpoints on one or more arcs in the module: select an arc, right-click, and select from the context menu. You can also set breakpoints in Java code for embedded operators and adapters.
-
In the Studio toolbar, click the
 Debug button. This opens the SB Test/Debug perspective and starts the
EventFlow application.
Debug button. This opens the SB Test/Debug perspective and starts the
EventFlow application.
-
Use the Manual Input view to send one tuple to the input streams of interest to your test. Blue highlighting begins to surround each component and arc in the EventFlow canvas as the tuple passes through each component, stopping at the first breakpoint encountered.
-
Use controls in the toolbar of the Debug view to stop, pause, resume, step into, and step over. If the module under test calls another module, the debugger opens it and continues tracking the progress of the tuple, then returns to the calling module.
-
Click the red stop button in the Debug view or the
 Stop Running Application button in the Studio toolbar to stop debugging and return to the SB Authoring perspective.
For the simplest debugging experience for EventFlow modules with an Extension Point operator, it is a best practice temporarily disabling the Run this component in a parallel region option in the Concurrency tab of the Properties view for Extension Point operators. This setting alters the behavior of stepping into a module referenced by an Extension Point, especially when using the Broadcast style of module dispatch. With Broadcast module dispatching, and threading disabled, the debugger steps through each module referenced by the operator. However, with threading enabled, the behavior of the debugger's step-into function is altered, and only the first module is stepped through.
If temporarily disabling multi-threading during debugging is not an option, debugging is still possible, though at a more advanced level. For example, while suspended at an input arc of a multi-threaded Extension Point, you can set a breakpoint inside one or more of the modules referenced by the Extension Point. While a subsequent Step Into still does not step into a referenced module (since stepping only occurs within a single thread), the step causes the Extension Point to reference and execute one or more modules in separate threads. If the debugger encounters breakpoints in those referenced modules, the debugger suspends the new thread or threads at each breakpoint's arc. At this point, realize that the Debug view lists multiple threads, and more than one thread can be suspended at any given time.
- Arc Breakpoint
-
A marker that pauses a thread of the program when execution reaches that EventFlow arc.
- Execution point
-
The paused location in the execution flow of a thread, just before the next statement to be executed.
- Watchpoint
-
A setting that stops the running program when a variable is written or read.
- Launch
-
A run configuration loaded into the Debug view that shows the debugged processes, their threads, and the stack traces of suspended threads.
- Stack Trace
-
The current stack of EventFlow arcs and/or Java frames for a suspended thread.
- Process
-
A single thread representing an independent executable portion of a running EventFlow application.
- VM
-
The Java Virtual Machine interpreting the StreamBase application.
This section introduces the EventFlow Debugger views and commands. There are four views used by the EventFlow Debugger:
- EventFlow Editor
-
Use this view to create and remove breakpoints, and to follow the flow of execution as it passes through your EventFlow application.
- Debug view
-
Includes an entry for the running EventFlow application's process, and threads of that process are listed as children. Use the toolbar buttons of this view to pause and resume your running application, and to step into or step over modules.
- Breakpoints view
-
Use this view to edit breakpoint properties.
- Variables view
-
Shows data associated with the currently selected arc or Java frame of a thread in the Debug view. If the Debug view's selection is an EventFlow arc, the Variables view displays the fields of the arc's tuple, as well as dynamic variables of the associated module, and table contents.
When the debugger is paused at a breakpoint, you can edit the contents of a variable in the Variables view as described in Variables View below.
During an EventFlow debugging session, you:
-
Suspend individual threads of your EventFlow application using the Debug view.
-
Set breakpoints in the EventFlow Editor.
-
Select a thread's arc or Java frame in the Debug view to inspect in the Variables view.
The EventFlow Editor shows the flow of the EventFlow application and marks any arcs containing breakpoints with a symbol. Select an arc and right-click to access the Toggle Breakpoint, Disable Breakpoint, and Enable Breakpoint commands from the context menu.
When a thread is suspended, the Debug view entry for that thread can be toggled open to display the thread's stack trace. You can then select an arc or Java frame in that stack trace. If a Java frame is selected, the corresponding Java source is opened in the Editor and the corresponding source line is highlighted, just as is done in traditional Java debugging. If an arc is selected in the Debug view, the corresponding EventFlow module's source is opened in the Editor, and the thread's path to that arc in the module is highlighted in blue, with the selected arc and its target operator highlighted with an outline.
The Debug view allows you to manage the running or debugging of one or more programs in the Studio workspace, including an executing EventFlow program. The Debug view includes a hierarchical list whose top-level elements are the active running or debugged processes. Under the process node for a StreamBase application are listed the threads of that application. In turn, when a debugged thread is suspended, the Debug view displays its stack, which in general consists of a combination of arcs and Java frames (if Java-based operators are involved). Monitors, System Threads, Qualified Names, and Thread Groups are optionally shown in the Debug view.
To compare with debugging a Java application, in place of Java statements, arc elements in the stack trace represent StreamBase arcs.
For the purpose of controlling program execution via stepping, an arc is treated as a single statement, and modules are treated as functions. Therefore, when suspended at an arc that is an input to a Module Reference or Extension Point, a Step Into command steps (not to the next Java statement, but) to the next traversed arc in the thread, which is typically inside the referenced module. However, a Step Over command at the same point steps (not over the next Java function call, but) over the referenced module, so that execution suspends at the next arc traversed in the thread, after execution has returned from the referenced module.
If your EventFlow application includes custom Java code, switching back and forth between debugging your EventFlow application
and Java code is automatic while stepping through a module. Use the Toggle debugging mode button ![]() on the right side of the Debug view's toolbar to switch modes manually.
on the right side of the Debug view's toolbar to switch modes manually.
The commands described in the next sections are available from the right-click context menu when a thread or frame is selected. The most-used command are repeated as the view's toolbar buttons.
- Resume
-
Allows a process to return to the running state.
- Suspend
-
Removes a process from the running state for inspection without unloading its threads.
- Terminate
-
When using the EventFlow Debugger, the red square Terminate button in the Debug view's toolbar (
 ) performs the same clean shutdown of the running StreamBase Server instance as the Stop button () in the main Studio toolbar. The terminated debug session cannot be resumed. The SB Test/Debug perspective closes and the
previous perspective is restored.
) performs the same clean shutdown of the running StreamBase Server instance as the Stop button () in the main Studio toolbar. The terminated debug session cannot be resumed. The SB Test/Debug perspective closes and the
previous perspective is restored.
- Terminate and Relaunch
-
Stops the current process and unloads its threads, then immediately restarts the current module.
- Disconnect
-
Disconnects the debugger from the running StreamBase Server. This allows a remote launch and its processes to continue running without further interaction with debugging commands.
- Remove all Terminated, Relaunch
-
Not meaningful for EventFlow debugging.
- Edit
launch-configuration-name -
In StreamBase Studio, launch configurations are usually named the same as the module being run. This command invokes the Edit Configuration dialog that lets you change some of the configuration settings of the currently running module. For example, you can change the logging level or enable intermediate stream dequeuing while the module is still running.
- Edit Source Lookup
-
Opens a dialog that lets you specify the disk location for the Java source code for custom operators and adapters in the current module. This location is automatically set by Studio to files in the Java Build Path for the current module's Studio project, so this command is rarely needed for EventFlow debugging.
- Terminate and Remove, Terminate/Disconnect All
-
Same as Terminate for EventFlow debugging.
- Step Into
-
Enters a module or executes the next operator in the current stream. The EventFlow application suspends at the next available execution point, which can be inside a module in a separate EventFlow file, or inside Java code called by a custom Java operator.
- Step Over
-
Executes the entire function of a module or execute the next operator in the current stream. The EventFlow application suspends at the next available execution point in the current EventFlow file.
- Step Return
-
Executes the entire function of the current module or EventFlow application until control passes to the calling EventFlow application.
- Drop to Frame
-
Select a frame line in the Debug view and invoke Drop to Frame from the toolbar button or context menu. This resets the current execution step back to the selected frame. Use this feature to go backwards in the tuple flow while debugging, which lets you return to inspect the state of an operator you have already stepped through. However, be aware that Drop to Frame cannot undo any side effects of components already stepped through, so it is not a true rewind.
- Drop to Arc
-
This command appears only in the context menu for a selected arc on the canvas. This is much like Drop to Frame for the selected arc: execution is reset back to the selected arc. Like its frame counterpart, Drop to Arc cannot undo any side effects of components already stepped through.
The flow of tuples might pass through the same arc more than once, such as in a loop, or if a module is traversed multiple times. In these cases, Drop to Arc is ambiguous, so Studio drops back to the most recent traversal of the arc. If that is not what you wanted, select the particular arc-frame of interest in the Debug view and use Drop to Frame.
- Run to Arc
-
This command appears only in the context menu for a selected arc on the canvas, and is only active when debugging is in progress. Like Run to Line in Java debugging, this command is like a fast-forward control. It sets a temporary breakpoint on the selected arc and resumes execution of the module, stopping at the selected arc. If an intervening breakpoints between the current location and the selected arc is hit, the Run to Arc is cancelled.
Note
Run to Arc is the preferred method for stepping through a sequence of operators. If you repeatedly step into or over too rapidly you can generate errors of various types, which can include messages in the Error Log, problems with data in the Variables view, and in the worst case, a hang of Studio. Therefore, when you know which downstream arc you want to reach, instead of repeatedly single-stepping to get to there, right-click over that arc and choose Run to Arc. Beside saving you time, running to an arc avoids problems that single-stepping too quickly can cause.
- Use Step Filters, Edit Step Filters, Filter Type, Filter Package
-
Not meaningful for EventFlow debugging.
The Breakpoints view lists the breakpoints you currently have set in your workspace. You can double-click a breakpoint to display its location in the editor (if applicable). You can enable or disable breakpoints, delete them, add new ones, group them by working set, or set hit counts. This view also controls whether suspension applies to only one thread, or to the entire VM. (Additional control and inspection is available if the entire VM is suspended.)
The commands described in the next sections are available from the toolbar and the right-click context menu.
- Remove Selected Breakpoints
-
Selected breakpoints are removed.
- Remove All Breakpoints
-
All breakpoints shown are removed.
- Show Breakpoints Supported by Selected Target
-
Filters the display to show only the breakpoints which affect the current Launch.
- Go to File for Breakpoint
-
Opens the EventFlow application in the EventFlow Editor in which the selected breakpoint is defined.
- Skip All Breakpoints
-
Permits the running EventFlow application to ignore all breakpoints.
- Suspend VM
-
Suspends the VM containing the breakpoint.
- Hit Count
-
Sets the number of tuples that must visit the breakpoint before it suspends the running EventFlow application. Upon resuming the application, that breakpoint is no longer enabled (its check box is cleared).
- Enable
-
Permits this breakpoint to suspend the VM or thread.
- Disable
-
Prevent this breakpoint from suspending the VM or thread.
- Remove
-
Removes this breakpoint from the EventFlow Editor.
- Remove All
-
Removes all breakpoints from the EventFlow Editor.
- Select All
-
Select all breakpoints.
- Copy
-
Copy the text description of a breakpoint into the system clipboard.
- Paste
-
Paste a breakpoint description into the Breakpoint view (if an appropriate target is available).
- Import Breakpoints
-
Read defined breakpoints from a file into the Breakpoint view.
- Export Breakpoints
-
Save the breakpoints to an external file.
- Breakpoint Properties
-
Edit the behavior of a breakpoint (Enabled, Hit Count, Suspend Thread or VM).
- Expand All
-
Show all breakpoints in the workspace.
- Collapse All
-
Show only the top level hierarchical nodes.
- Link with Debug View
-
When an EventFlow application suspends on a breakpoint in the Debug view, the associated breakpoint will be highlighted in the Breakpoints view.
- Add Java Exception Breakpoint
-
Not meaningful for EventFlow debugging.
- Group By
-
Specifies nested groupings for the Breakpoints view.
- Working Sets
-
Define a specific set of breakpoints to appear in the view.
- Select Default Working Set
-
Select a set of breakpoints to appear in the view.
- Deselect Default Working Set
-
Reset the view so that no working set is selected.
- Show Qualified Names
-
Not meaningful for EventFlow debugging.
The Variables view can display information about the tuple associated with an arc or output stream that is selected in the Debug view. The tuple's fields are listed in the Variables view. The view displays data hierarchically, so if a field's type is a tuple or list, it can be expanded to see sub-fields or list elements, respectively.
To enable the debugger to step faster, text for fields of type tuple, list and blob is elided in the Variables view for fields containing large amounts of data. You can view the full values of abbreviated tuples by selecting a row. The complete representation of data for that row displays in the Details pane at the bottom of the Variables view.
Fields of type blob display either as hex characters or ASCII characters. To control how blob data displays, go to >>>. Set the hex or ASCII characters option and specify the Maximum blob characters to display.
When the debugger is paused at a breakpoint, you can edit the contents of a variable in the Variables view in two ways:
-
Select the field in the Variables view, right-click, and select Change Value from the context menu. Edit the selected field in the resulting Set Value dialog.
-
Change the value directly in the details pane for the selected field.
When you resume stepping through the EventFlow application, StreamBase uses the newly edited value.
The commands described in the next section are available from the toolbar and the right-click context menu.
- Show Type Names
-
Not meaningful for EventFlow debugging.
- Show Logical Structure
-
Not meaningful for EventFlow debugging.
- Collapse All
-
Show only the top nodes.
- Layout > Vertical View Orientation
-
Place the list above the detail pane in the view.
- Layout > Horizontal View Orientation
-
Place the list to the left of the detail pane in the view.
- Layout > Variables View Only
-
Hide the detail pane.
- Layout > Show Columns
-
Toggle whether columns appear, providing additional information.
- Layout > Select Columns
-
Optionally show additional information including Name, Declared Type, Value, Actual Type.
- Java
-
Not meaningful for EventFlow debugging.
- Select All
-
Highlights all rows in the hierarchical list.
- Copy Variables
-
Copy the text description of selected fields to the system clipboard.
- Find
-
Select fields by name.
- Change Value
-
Not meaningful for EventFlow debugging.
- All References
-
Not meaningful for EventFlow debugging.
- All Instances
-
Not meaningful for EventFlow debugging.
- New Detail Formatter
-
Not meaningful for EventFlow debugging.
- Open Declared Type
-
Not meaningful for EventFlow debugging.
- Open Declared Type Hierarchy
-
Not meaningful for EventFlow debugging.
- Create Watch Expression
-
Not meaningful for EventFlow debugging.
- Inspect
-
Add the selected tuple to the Expressions view. Note that Watch Expressions are not supported for StreamBase data types.
The EventFlow debugger supports traditional Java breakpoints in embedded Java code and breakpoints set on arcs in EventFlow modules. The breakpoint lifecycle begins when you select arcs in the EventFlow Editor from which to initiate inspection and control of the EventFlow application. An active arc breakpoint pauses the thread that encounters it and meets its filter criteria. When one or more threads is suspended, each suspended thread's state can be inspected.
To create or remove a breakpoint, right-click an arc in the EventFlow Editor and select from the context menu, or use the keyboard shortcut Ctrl+Shift+B. You can apply breakpoints to multiple selected arcs at the same time. To enable or disable an existing breakpoint, right-click and select or .
To set additional properties of a breakpoint, open the breakpoint's Properties dialog. You can do this in two ways:
-
Right-click an arc in the EventFlow Editor and select .
-
In the Breakpoints view, select and right-click a breakpoint, then select .

In both cases, a Breakpoint Properties dialog opens like the following example:
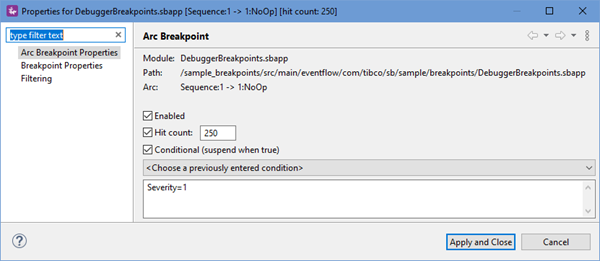 |
This dialog allows you to limit the suspension of the program at the selected breakpoint.
-
Hit count allows you to specify an integer
Nfor the number of times the breakpoint is hit before the program is suspended. Execution of the program suspends when the breakpoint is hit for theNth time. This behavior is inherited from the Eclipse JDT debugger. -
Conditional (suspend when true) lets you specify a StreamBase expression that evaluates to a Boolean value. The debugger only suspends execution at that breakpoint if the expression evaluates to
true. This behavior is inherited from the Eclipse JDT debugger.
You can create, enable, and modify breakpoints at any time during the editing or debugging session, even while the application is running. However, most useful tasks are done when the application is suspended.
Most EventFlow applications consist of multiple threads that take input from continuously running input sources. Pausing a single process or thread does not pause processes running outside the VM, so input buffers can fill while parts of an application are paused. Take care to control input data while debugging in order to minimize the impact of pausing the main application.
Consider the following points when setting and using conditional breakpoints:
-
In addition to the Breakpoint Properties dialog described above, you can keep a portion of the dialog always open in the Breakpoints view. To do this, use the icon to the top right of the Breakpoints view to open its menu. Select > to show the Hit Count and Conditional settings for the currently selected breakpoint. The setting places these controls either horizontally or vertically inside the Breakpoints view, depending on your current perspective layout and window size. You can also select > or > to force the controls to your preferred location.

-
If the specified condition evaluates to null, that is treated as if the expression's value was false. In this case, the debugger does not suspend at that breakpoint's arc.
-
If expression evaluation fails because of a syntax error in the expression, the first time the arc is traversed, the relevant server-side thread suspends, and an error dialog warns of the syntax error. The error dialog gives you the option to display the breakpoint's properties dialog so you can edit the condition expression.
-
Expression evaluation might fail because of a runtime error, such as when an expression causes a divide-by-zero error. In this case, the debugger suspends, and an error dialog explains the problem and provides an opportunity to edit the expression.
-
The condition expression might resolve to a non-Boolean value. This case is treated the same as a runtime error, with the resulting error dialog stating "Could not convert the result of the expression to a boolean."
A tuple's fields are displayed in the Variables view any time the EventFlow application is suspended and the execution point is at an arc or output stream. A thread is typically suspended at an arc or output stream after an arc breakpoint was hit, or after a debugger step operation ends at an EventFlow arc or output stream.
Tip
Place the Variables view, Debug view, and Output Streams view in separate portions of the Studio screen so you can see the contents of all tabs at the same time. The step commands are in the Debug view, but the tuple values are visible in the Variables view.
The drop-down menu near the upper right corner of the Variables view, gives you the option to hide null values in tuples fields, list elements, and dynamic variables, as the following screen shot shows.
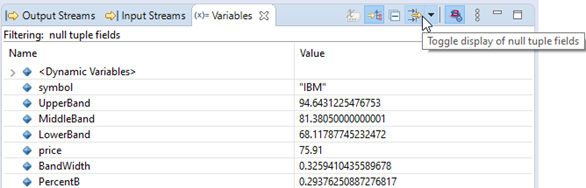 |
Click this menu and toggle its items to display or hide null values, as illustrated below.
 |
You can inspect the contents of Query Tables in the Variables view. Query Tables are shown with their fully qualified paths in the Value column of the Variables view.
As with Hit Counts on Java Breakpoints, you can specify a Hit Count on an arc breakpoint to delay suspension at that arc until a specified number of tuples have traversed (that is, hit) that arc. To specify a hit count, first set the arc breakpoint: right-click an arc and select Toggle Breakpoint. Then in the Breakpoints view, select the corresponding breakpoint, right-click and select Breakpoint Properties. The dialog that appears lets you enable the option, and lets you specify the count. During debugging, if that count is reached, the debugger disables the option for that breakpoint.
The debugger works in either of two modes based on suspension policy, either to suspend the thread on a breakpoint or suspend the VM on a breakpoint. If the VM is suspended, support services such as Heartbeat are also suppressed. If only the thread is suspended, all other threads continue. This can introduce tuple ordering differences in EventFlow applications with multiple parallel concurrent operators and modules, which would not occur during normal operation.
This section describes limitations of the EventFlow Debugger and suggests tips for making the best use of it.
- Stepping Into or Over Certain Operators is not Supported
-
The EventFlow debugger does not support stepping into or stepping over any of the listed operators. However, you are free to set breakpoints upstream or downstream of these operators.
-
Gather
-
Merge
-
Pattern
-
Decision Table
For debugging a Decision Table operator, consider using the features of the Decision Table Analyzer to get a debug-like view of how a Decision Table operator responds to different input tuples.
-
- Debugger May Miss Arc Breakpoint During Single-Stepping
-
If you single-step quickly and repeatedly while debugging a StreamBase application, unpredictable errors can occur. The types of errors vary, and may include errors in the Error Log, problems with data in the Variables view, or significant performance degradation in StreamBase Studio. You can work around this issue. If you know which upstream arc at which you'd like to stop, instead of repeatedly single-stepping to get to that arc, right-click over the upstream arc and select . This method is often easier and faster, and it avoids problems from single-stepping too quickly.
- Cross-Thread Stepping Not Supported
-
Just as Java debugging does not support cross-thread stepping, so with EventFlow debugging. This means the Step or Step Into debugger functions cannot step into a Module Reference or Java operator that is marked to run in a parallel region. To continue debugging, you can temporarily disable the Run this component in a parallel region option in the Concurrency tab of the Properties view for the operator or module reference, though that change cannot be done during a debugging launch. During a debug launch, you can set breakpoints in a referenced module or in the code of a Java operator, and such breakpoints are hit in the separate threads.
- Single-Step With Caution
-
Single-stepping too quickly by repeatedly pressing F6 as fast as possible can hang or even crash the Debugger.
- Debugger Paused Without Visible Indications
-
In rare circumstances, the Debugger can pause as if it has hit a breakpoint or has stepped to the next arc in sequence, but neither the Debug view nor the EventFlow canvas shows where or why the Debugger is suspended. In these cases, try double-clicking each thread in the Debug view. One of those threads is likely to reveal a paused thread.
- Debug View Focus Can Appear to be Lost When Stepping
-
Focus in the Debug view can be intermittently lost when you are stepping through a module at a high speed (for example, by frequently pressing the F6 button). If this occurs, reselect any stack trace element in the execution stack of the Debug View and continue stepping.
- No Indication of Loop Count
-
When debugging an EventFlow loop, components are highlighted and black-bordered as expected as the tuple proceeds around the loop, but there is no indication of how many times the loop has been traversed.
- Dynamic Variables in Variables View Might Come From Sequence Operators
-
Be aware that the Sequence operator uses dynamic variables as part of its implementation, so you will see a dynamic variable entry for the sequence IDs generated by Sequence operators in the module you are stepping through.
- Out of Memory for Very Large Applications, Debugger May Not Start
-
Very large, multi-module applications may report out of memory errors when attempting to start them in the Debugger. You can try one or more of the following suggestions to increase the memory available for debugging large applications:
-
Debug using 64-bit Studio on a supported 64-bit platform.
-
Allocate memory to Studio and the application under test separately. For example, using 64-bit Studio on a machine with 8 GB of RAM, try allocating 2 GB to Studio and the rest to your application. Specify Studio's memory usage with a
-Xmx2048Msetting in theSTREAMBASE_STUDIO_VMARGSenvironment variable. Specify requested and maximum RAM values for the application under test using-Xmsand-Xmxsettings in the Run and Debug Configuration for the application. See Java VM Memory Settings and Editing Launch Configurations for details. -
Use the Compile StreamBase application in separate process option, specified in the Advanced Server Options section of the Main tab of the Launch Configuration dialog, as described in this section of the Editing Launch Configurations page.
-
- Possible Slow Response under Certain Conditions
-
There are conditions under which the EventFlow Debugger causes StreamBase Server processing to slow down. In particular, this can happen if a stack trace in the Debug view is especially deep because the path to the current execution point arc is very long.
The EventFlow Debugger can stop on breakpoints in early-running code, such as in the init() method for custom operators and adapters. However, to support early breakpoints, you must launch the Debugger in the background.
Follow these steps:
-
Use > to open the Debug Configurations dialog.
-
In the left side column, select the debug configuration for the module you want to debug.
-
Select the Common tab.
-
Select the check box labeled Launch in background.
-
Click the button to run this configuration now.
If the Debugger is launched in the foreground and hits a breakpoint before StreamBase Server container initialization completes, Studio skips that breakpoint and shows a dialog that reminds you of the steps in this section.