Contents
- Measure Current Performance to Establish Baseline for Comparisons
- Filter Early, Filter Wide
- Define or Process Minimal Inbound Tuples
- Consolidate Multiple Map Operators
- Set Query Table Cache Size If Using Disk-Based Option
- In Clients, Narrow Results with Filtered Subscriptions
- Add Custom Functions to Increase Performance
- Consider Using Concurrency and Data Parallelism Features
- Tune Memory Parameters
- Increase Computing Resources
Measure the current performance of your StreamBase application before starting a tuning project. You can then use the current performance numbers as a baseline, and observe the positive or negative results of experimenting with different application designs and configuration settings.
If you have the resources, create a final test or staging environment that contains the same hardware and software configuration you propose to use when the application is deployed into production.
In general, you may notice that applications typically have bottlenecks that slow the overall throughput. Bottlenecks can occur with:
-
Enqueuing (input) speed in adapters or clients
-
Dequeuing (output) speed
-
Operators waiting for matching tuples on queues (Merge, Join, Gather), which could benefit from the addition of Heartbeat operators
-
Possible misuse of Aggregate or Query operators
-
Java operators that are providing custom functionality, but are not performing well
To measure normal and peak performance of a StreamBase application, you can use several tools:
-
The StreamBase Feed Simulator provides a convenient way to send test data to your application during the development and testing phases. It is also a good tool during staging, where you can submit real world data through a feed simulation that uses CSV input files specified in a feed simulation configuration file. For example, the Moving Average Convergence Divergence (MACD) sample installed with StreamBase contains the
MACD.sbfsconfiguration file that references the test data fileMACD.csv. Run the sbfeedsim command from the command line to submit test data to your application. Do not use the Feed Simulation view in StreamBase Studio for performance testing, as it incurs the overhead of Studio, which may skew your results.For further information, see Using the Feed Simulation Editor and the sbfeedsim command reference. Feed simulation configurations provide many options, including the ability to throttle up the data rate to stress-test the application closer to expected peak data rates.
-
With your application running, you can use one of the StreamBase monitoring utilities to see which operators are hot spots — that is, which ones receive the most tuples, and which threads are using the most CPU resources. Once hot spots are identified, you can distribute the processing of hot spot operators into separate threads. See Monitoring and Profiling Applications to determine which monitoring utility to run.
You can also write you own monitoring utility as described in Developing StreamBase Monitor Applications in the API Guide.
For traditional and real-time applications, an important guideline is to minimize the amount of data movement for a given task. This simple rule is critical when processing high-volume, real-time data streams.
Avoid defining multiple sets of Filter operators too far downstream in your application (where downstream means toward the right side of the EventFlow). Instead, spit the data as soon as possible after it enters an Input Stream, so that the downstream operators only process or move the data appropriate for that path through the application. A common design mistake is to add multiple Filter operators throughout the EventFlow, when a single Filter operator with multiple predicates (expressions that result in TRUE or FALSE) would be sufficient to do the work, and would not incur the overhead of excessive data movement.
Remember that each operator in a StreamBase application has to move data in, and move data out. Assume for the moment that the cost of performing these steps, per operator in your application, is 1. In reality, the cost is different for each operator, but let's start by adding up the costs of moving data through applications using varying designs.
Example 1: Simple View of Just Moving Tuples Through Three Operators
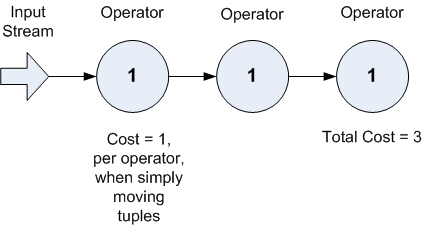
In the example above, the total cost to simply move tuples through the operators is 3.
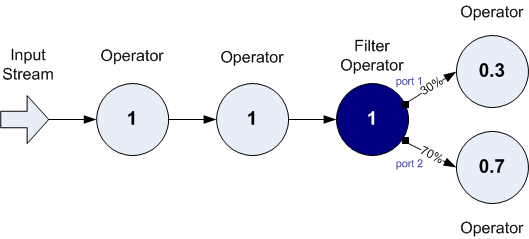
In the next example, consider the cost when you add a Filter operator on the right side (downstream) of the EventFlow. In this example, assume that the Filter operator's predicates and the inbound data values resulted in 30% of the tuples being moved out port #1, and 70% out port #2, to the next set of downstream components:
Example 2: Filter Operator is Added, But Too Far Downstream for Efficient Processing
We can redefine this application so that the Filter operator does the split processing further upstream, closer to when the data first enters the system. Doing this avoids moving 100% of the data tuples through the operators that preceded the (further downstream) Filter operator shown above.
Example 3: Filter Operator Moved Upstream, Avoiding Expensive Data Movement by Downstream Operators
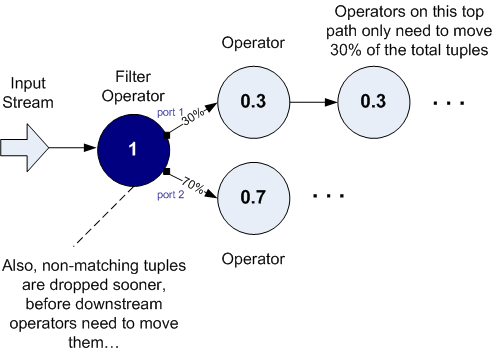
In the example above, we pushed our predicates in the Filter operator upstream (to the left in an EventFlow), to reduce the flow of tuples in the downstream operators. In addition, you can define your Filter operator so that the predicates cover the conditional cases you want, and also drop any non-matching tuples that do not return TRUE for any of the predicates. In doing so, you can design the application so that uninteresting data records do not clog your system, further reducing the cost of data processing and increasing the overall throughput of the application.
Filter operators are efficient. The point is that the more expensive operation is actually moving the data, not determining how to split the data based on the predicate expressions.
The previous section described increasing performance by performing data filtering as early as possible in the EventFlow. We can generalize this rule for more cases than filtering: optimize performance by reducing the number of tuples processed on each path, or the number of fields in each tuple, as early as possible. Narrowing down the tuples to the essential fields has the biggest benefit when you do this at the source, before the data is enqueued into StreamBase. So if possible for your application, determine which fields are essential for a tuple, and remove any unnecessary fields.
For data that must be entered into the StreamBase application, you can use the Filter and Map operator to define criteria that set when certain tuples can be dropped from the stream. However, these operators have caveats about their placement in an application, as noted in the previous section about Filters, and the next section about Maps.
Remember: developers who are new StreamBase tend to focus on the relative processing cost of individual operators or operator type. However, the number of tuples processed by the operator dominates the relative cost of the operator.
As an application developer, you have an instinct to design or create modular code. In the case of StreamBase applications,
this can sometimes result in using multiple sets of Map operators. You might think that (for example) Map1 should change the value of FieldA, while Map2 should exist to do something to the value of FieldB, and Map3 could drop FieldC and FieldD. However, unless Map2 is dependent on the result of Map1's processing, and unless Map3 is dependent on the results of Map1 and Map2's processing,
you can consolidate these Map operators into a single Map, and use multiple expressions to perform the work. Using one Map
operator is much more efficient in performing the work and not forcing the application to move data three times before it
is then sent to the next downstream component.
Moving data has a cost, and so does evaluating expression and changing the schema. As noted earlier, filter streams as far to the left in the EventFlow as you can. And mutate with a Map operator as far to the right in the EventFlow as you can.
The Rule of Thumb summary is: filter on the left, mutate on the right.
If your application uses disk-based Query Tables (and your license enables their use), your performance can improve if you increase the cache size internally allocated to disk-based query table operations.
Consider the <server> element of the server configuration file:
<server>
  <param name="tcp-port" value="portno"/>
  <param name="datadir" value="dir"/>
  <param name="disk-querytable-cache" value="number"/>
</server>
The disk-querytable-cache parameter is commented out by default. The value attribute sets the amount of main memory to be allocated to any disk-based query table operations. The value units are in
MB of main memory and must be a power of 2. When unspecified, the default value is 1 MB. Use caution when setting this parameter,
as too high a value can consume more memory than needed and could negatively impact other resources that require memory during
the execution of the StreamBase application or other applications. The memory footprint of the sbd program is increased by the amount specified in this parameter. As with any resource setting, establish baseline performance
metrics and then test the effect of increasing or decreasing values under normal and peak loads.
Use the StreamBase Client library to write a consumer dequeue client that narrows the result set, by using a predicate on the subscription to an output stream. You can write client applications in Java, C++, Python, or a .NET language.
The predicate is applied to the data output from the stream before it is delivered to the client. By narrowing the result set that the server must provide to the client, you can increase the efficiency of your application. The predicate language follows the same rules and syntax as implemented in the Filter operator.
The client sample shipped with StreamBase provides client program examples. For further details, see Narrowing Dequeue Results with Filtered Subscribe in the API Guide.
You may find that the processing of your application can be improved by introducing your own custom functions, instead of performing special calculations in client applications. Once implemented and configured, your custom functions can be used in the expressions of most operators in your application. To learn how to write your own functions by extending the StreamBase Java or C++ APIs, see these API Guide topics:
The Properties view for most StreamBase components has a Concurrency tab that lets you specify running that component in a separate thread, with data parallelism options. For compute-intensive components that you know can be run without data dependencies on other components in the StreamBase application, you may be able to improve performance by enabling these options.
When a component runs in its own parallel region, the server processes the component's requests concurrently with other processing in the application. The processing of the threads may be distributed automatically across multiple processors on an SMP machine.
The concurrency features are not suitable for every application. For details, see Execution Order and Concurrency, which includes important cautions on using these features.
See Java VM Memory Settings for a discussion of the settings that affect the amount of memory usable by StreamBase Studio and StreamBase Server.
If design and configuration changes do not result in sufficient performance, consider increasing your computing resources, such as the processor speed, the number of processors on an multiprocessor machine, and the amount of memory. You can also investigate using a cluster of StreamBase Servers using high availability techniques. See Clustering and High Availability for more information.