Contents
This chapter provides a high-level overview of the administration architecture and capabilities available to manage StreamBase® applications.
Architecture Guide described the general structure of applications. In that chapter applications and fragments were introduced and how they are deployed on nodes in a cluster. This chapter provides more details on the deployment and administration models.
The following concepts are used to describe the deployment architecture:
-
Machine — an execution context for a node.
-
Application — business specific functionality.
-
Fragment — an executable part of an application.
-
Cluster — a logical grouping of nodes that communicate to support an application.
-
Node — a container for engines.
-
Engine — executable context for a fragment.
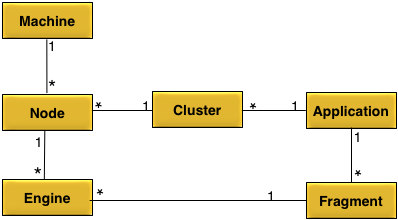
An application is executed on one or more clusters.
An application contains one or more fragments.
A fragment is executed on one or more engines.
A cluster can host a single application.
A cluster can contain one or more nodes.
A node can belong to one cluster.
A node can host one or more engines.
A machine can host one or more nodes.
The concepts described in Conceptual Model are mapped to physical entities as follows:
-
Machine — a physical or virtual computer.
-
Application — an application archive containing one or more fragments generated at design time as described in Design Time.
-
Fragment — a fragment archive containing executable application code generated at design time as described in Design Time.
-
Cluster — a collection of nodes interconnected by a network.
-
Node — a set of operating system processes running on a machine and monitored and managed by a node coordinator process.
-
Engine — an operating system process running a fragment that is managed by the node coordinator.
Figure 4, “Deploying an application” shows a diagram of all of the physical entities.
A node consists of multiple operating system processes as shown in Figure 2, “Node processes”.
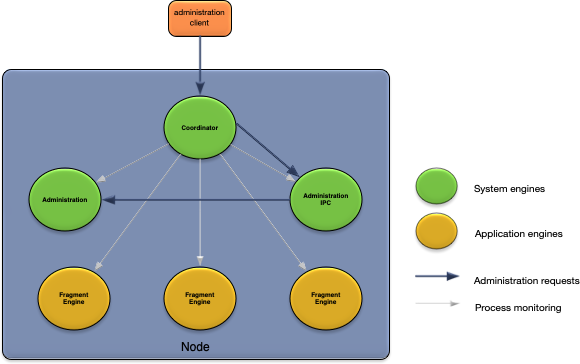
These operating system processes can be grouped into two categories:
-
system — engines hosting node services required to support applications.
-
application — engines hosting application fragments.
There are three system engines (processes) started when an node is installed:
-
Coordinator — node coordinator process. Process name is
swcoord. Starts and monitors all other node processes and hosts the administration port. -
Administration — node administration. Process name is
System::administration. Provides node administration commands. -
Administration IPC — node Inter-Process Communication (IPC) service. Process name is
System::swcoordadmin. Provides an IPC mechanism between the node coordinator process and the rest of the processes on a node to support administration commands.
There is an application engine (process) started for each fragment deployed on a node. These engines have a process name of
application::<engine-name>.
All nodes are uniquely identified by a service name. A service name consists of these parts:
-
a cluster name
-
optional grouping
-
a node name
Cluster, group, and node names are labels. The valid characters for a label are letters, numbers, and the hyphen (-) character. No other punctuation is permitted. Labels must use the UTF8 character set encoding.
A fully qualified service name consists of at least two labels separated by a period. A fully-qualified service name includes the cluster name, the node name, and all grouping labels.
A partially qualified service name consists of at least one label, the cluster name, with a leading period. A partially qualified service name does not include the node name, and optionally only a subset of any grouping labels. A single label without a leading period is a special case and is treated as a cluster name.
Service names are arranged in a hierarchical tree structure, where the cluster name is the root of the tree and a node name is the leaf. The optional grouping part of a service name are the branches between a cluster name and a node name, or more formally:
servicename = [nodename-label.[[group-label.]*]]clustername.label
Here are some example service names:
a.applicationcluster
b.eastcoast.applicationcluster
c.eastcoast.applicationcluster
d.westcoast.applicationcluster
e.westcoast.applicationcluster
These service names uniquely identify five different nodes, all in the same cluster.
Services names are used by the discovery service (see Discovery Service) to locate network address information. Discovery can be performed using a fully-qualified or a partially-qualified service name. Fully-qualified service names always identify a single node. Partially-qualified service names may resolve to one or more nodes. For example using the service names above:
applicationcluster // resolves to all five nodes - notice no leading "."
.applicationcluster // resolves to all five nodes
.eastcoast.applicationcluster // resolves to nodes b and c.
.westcoast.applicationcluster // resolves to nodes d and e.
a.applicationcluster // resolves to node a.applicationcluster.
From the examples above, it can be seen that service name grouping allows sets of nodes to be resolved using a partially qualified service name. This is useful for administrating multiple nodes together. For example:
-
nodes in different geographical locations might be configured with different connectivity.
-
nodes grouped together to provide different high-availability guarantees.
-
nodes that host one type of functionality may require different configuration from other nodes.
-
nodes hosting different clients might require different operational rules.
The discovery service allows details about a node to be discovered using a service name, instead of specific network address.
When a node is installed it is available for discovery by the discovery service. A node registers multiple service records. Each service record has a different service type. Each service type makes available a different set of service properties that can be discovered. The different service types and properties are used by both nodes and client tools to dynamically discover information needed to perform specific tasks. For example, the administration client tool uses service discovery to dynamically find the administration port of a node.
Note
It is recommended that service names be used instead of network addresses when accessing nodes.

Service discovery uses the UDP protocol to provide its services. To enable service discovery to work across machines, the UDP protocol must be enabled in all network routers and switches between nodes using service discovery.
Each node starts a UDP listener on all interfaces on the machine on which the node is running. All nodes in a cluster must use the same UDP listener port to successfully use service discovery.
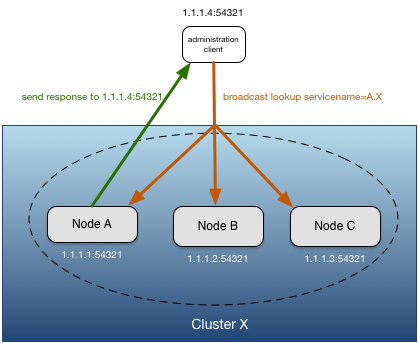
When a service discovery client, such as the administration tool, performs a service lookup, it sends a broadcast using the default broadcast port number, or a user specified port number. If the service discovery client is running on a multi-homed machine, the broadcast is sent on the interface that matches the local host name. Support is provided for explicitly specifying the interface(s) on which the broadcast should be sent. The client must send the broadcast on the same port number on which the nodes are listening for service discovery to resolve the nodes.
When a node receives a service discovery broadcast request, if the fully, or partially qualified, service name matches the node's service name, it sends a response directly back to the address that sent the request. Clients performing a service lookup may receive multiple responses to a single request for partially qualified service names and when multiple nodes are configured to provide proxy discovery services for the same node (see Proxy Discovery).
When a discovery client performs a service discovery lookup with a fully qualified service name, the discovery client completes the lookup when the first response is received, or no response is received after a configurable amount of time. When a lookup is performed with a partially qualified service name, a discovery client always waits a configurable amount of time for responses to the lookup.
As described in Network Architecture, service discovery relies on the underlying network supporting UDP broadcast. There are cases where this is not the case; common examples are:
-
Nodes communicating over a WAN to provide disaster recovery.
-
Nodes deployed to cloud infrastructure without a network overlay configured to support UDP broadcast.
To support service discovery in these environments proxy discovery can be used. Proxy discovery allows nodes that are not the requested service name to respond with the service properties for the requested service name. The network address information to return is configured in the node acting as the proxy. The network address information that is available from a proxy is:
-
data transparent listener address and port number
-
administration listener address and port number
While multiple nodes can act as a proxy for the same service name, it is critical that all of the nodes have the same information configured to ensure that consistent results are returned for discovery requests.
Note
When using proxy discovery, then epadmin display services always
shows all nodes as available, even if they are not running.
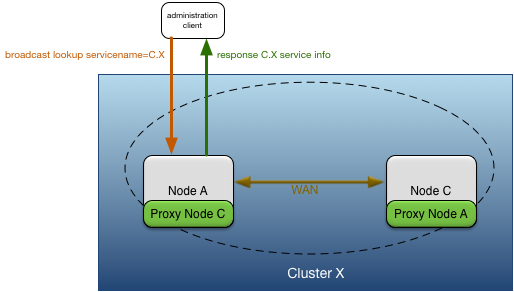
Figure 5, “Proxy discovery” shows node A providing proxy discovery services for node C because of the WAN connection between node A and C.
The downsides of using proxy discovery are:
-
The network addresses must be explicitly configured for all remote nodes, instead of being dynamically discovered. This makes elastic scaling of nodes more difficult because configuration must be changed as nodes join and leave a cluster.
-
Proxy discovery records are returned blindly by the nodes where they are configured. They do not reflect the current state of configured proxy nodes, making it very difficult to keep track of proxy records.
These service types are registered by nodes:
-
distribution — network address information for distribution.
-
eventflow — network address information for an EventFlow fragment engine.
-
http — network address information for administration web server.
-
liveview — network address information for a LiveView fragment engine.
-
webservice — network address information for an installed web service.
The service properties for each of these services types is summarized in the tables below.
distribution service type properties
| Property Name | Property Description | Example |
|---|---|---|
| Service Name | Fully qualified service name for node distribution service. | distribution.A.X |
| Network Address | One or more distribution listener network addresses separated by a space. | dtm-dist://IPv4:Kapoho.local:10625 |
| location code | Distribution location code assigned to node. | 70263 |
eventflow service type properties
| Property Name | Property Description | Example |
|---|---|---|
| Service Name | Fully qualified service name for an EventFlow fragment running in an engine. The naming convention is eventflow.engine-name.node-name |
eventflow.VitalStatsMonitor_sbapp0.A.X |
| Network Address | EventFlow client API network address with a format of sb://host-name:port-number (insecure) or sbs://host-name:port-number (secure).
|
sb://Kapoho.local:10000 |
http service type properties
| Property Name | Property Description | Example |
|---|---|---|
| Service Name | Fully qualified service name for node Web server. | http.A.X |
| Network Address | Web server network address. | http://Kapoho.local:8008 |
liveview service type properties
| Property Name | Property Description | Example |
|---|---|---|
| Service Name | Fully qualified service name for a LiveView fragment running in an engine. The naming convention is liveview.engine-name.node-name |
liveview.liveview1.A.X |
| Network Address | Multiple space separated network addresses. One for the EventFlow client API, either sb://host-name:port-number (insecure) or sbs://host-name:port-number (secure); and one for the LiveView client API, either lv://host-name:port-number (insecure) or lvs://host-name:port-number (secure). At least one of the insecure or secure network addresses will be present for both the EventFlow and LiveView client
APIs.
|
sbs://Kapoho.local:10000 lvs://Kapoho.local:11080 |
node service type properties
| Property Name | Property Description | Example |
|---|---|---|
| Service Name | Fully qualified service name for node. | A.X |
| Network Address | Node administration network address. | dtm-adm://dtm.tibco.com:32299 |
| applicationVersion | Version number of application running on node. | 1.0 |
| applicationName | Name of application running on node. | MyApplication |
| NodeState | Current state of node (see Nodes) | running |
webservice service type properties
| Property Name | Property Description | Example |
|---|---|---|
| Service Name | Fully qualified service name for web service. The naming convention is web-service-name.node-name.
|
admin.A.X |
| Network Address | Web service network URL. | http://Kapoho.local:8008/admin/v1 |
| Documentation Address | Web service API documentation URL. | http://Kapoho.local:8008/apidoc/admin.json |
A single K8s Service is maintained per Streaming node, containing mappings for these Streaming services:
-
Node Service
-
Distribution Service
-
Web Server Service
-
EventFlow Service
-
LiveView Service
The K8s Service is of type ClusterIP, and has fixed port numbers for each of the services. The K8s Service port/targetPort mechanism is used to transparently proxy the actual listener ports being used by the Streaming node's listeners.
The K8s Service is created within the K8s namespace of the pod where the Streaming node is running. All nodes within a Streaming cluster must use the same K8s namespace. Streaming discovery across multiple K8s namespaces is not supported.
Communication to the node listeners will be done through the K8s Service IP address and ports.
If running within K8s, the K8s Service is created by the Streaming node at node installation time, and modified as Streaming node services are added and removed.
The discovery service implementation type is detected at node installation automatically. If the node is installed in K8s, the node uses K8s Service Discovery, otherwise it uses UDP based service discovery.
K8s is detected by the presence of the K8s standard KUBERNETES_SERVICE_HOST environment variable.
The following example shows Kubernetes Service definition:
               # Mapped UDP node service name.
               # '.' is mapped to '-'
               #
Name:          sb10-node-name

               # The namespace of the pod where the node is running.
               #
Namespace:     default

Labels:        app.kubernetes.io/component=backend

               # Mapped UDP node service Application Name property.
               #
               app.kubernetes.io/name=My-Application

               # Mapped UDP node service Application Version property.
               #
               app.kubernetes.io/version=1.0

               # This valueless label allows for creating filters that select
               # all K8s Service instances.
               #
               discovery.tibco.ep.com/streaming-node=

               # Unmodified, UDP node service, Application Description property.
               #
Annotations:   discovery.tibco.ep.com/streaming-application-description: My Application Description

               # Unmodified, UDP node service Last Model Request Time property.
               #
               discovery.tibco.ep.com/streaming-last-model-request-time=2020-02-10-16-49-54-565-0800

               # Unmodified, UDP distribution service Location Code property.
               #
               discovery.tibco.ep.com/streaming-location-code=17059230419998788808

               # Unmodified, UDP node service Public Key property.
               #
               discovery.tibco.ep.com/public-key=...

               # This selector matches a label on the POD where the node is
               # running. The label is added to the POD by the discovery mapping
               # layer as part of creating this service. The value is the
               # K8s Service name which instructs K8s to establish a 1-to-1
               # relationship between the service and the POD. Having the
               # node name be part of the label name allows for multiple
               # nodes to run in a single pod.
               #
Selector:      discovery.tibco.ep.com/sb10-node-name : sb10-node-name

Type:          ClusterIP

               # The IP address of the service is chosen
               # by Kubernetes at the time of service creation.
               # Not related to the IP address of the K8s pod
               # where the node is running.
               #
IP:            10.152.183.53

Ports:
               # UDP node service
               #
               label : administration
               #
               # Fixed K8s port for UDP node service.
               #
               port : 2000
               #
               # The administration listener port on the pod
               # where the node is running.
               #
               targetPort : Provided by node.

               # UDP distribution service
               #   The -tls portion of the name will be present
               #   for a secure listener.
               #
               name : distribution[-tls]
               #
               # Fixed K8s port for UDP distribution service.
               #
               port : 3000
               #
               # The distribution listener port on the pod where
               # the node is running.
               #
               targetPort : Provided by node.

               # UDP http service
               #   The -tls portion of the name will be present
               #   for a secure listener.
               #
               name : http[-tls]
               #
               # Fixed K8s port for UDP http service.
               #
               port : 80
               #
               # The web server listener port on the pod where
               # the node is running.
               #
               targetPort : Provided by node.

               # UDP EventFlow service
               #
               name : eventflow-N[-tls]
               #
               # Fixed K8s port for UDP EventFlow service.
               #   N is the 1-based, instance number of the
               #   EventFlow JVM on the node.
               #   The -tls portion of the name will be present
               #   for a secure listener.
               #
               port : 10000+N-1
               #
               # The event flow listener port on the pod where
               # the node is running.
               #
               targetPort : Provided by node.

               # UDP LiveView service, LiveView listener
               #
               name : liveview-N[-tls]
               #
               # Fixed K8s port for UDP LiveView service
               # LiveView listener.
               #   N is the 1-based, instance number of the
               #   LiveView JVM on the node.
               #   The -tls portion of the name will be present
               #   for a secure listener.
               #
               port : 11080+N-1
               #
               # The LiveView listener port on the pod where
               # the node is running.
               #
               targetPort : Provided by node.

               # UDP LiveView service EventFlow(SB) listener
               #
               name : liveview-N-eventflow[-tls]
               #
               # Fixed K8s port for UDP LiveView service
               # EventFlow listener port.
               #   N is the 1-based, instance number of the
               #   LiveView JVM on the node.
               #   The -tls portion of the name will be present
               #   for a secure listener.
               #
               port : 11000+N-1
               #
               # The LiveView EventFlow listener port on the pod where
               # the node is running.
               #
               targetPort : Provided by node.
Services are always published using the current fixed K8s port numbers.
The K8s fixed port numbers may change from release to release. To support upgrades, the discovery services accepts arbitrary K8s port numbers for discovered services.
The UDP discovery service is general purpose, treating all service properties as strings, with only a few constraints on size and uniqueness.
The mapping between UDP and K8s is defined below.
The following UDP service types are supported:
-
node - Node Service
-
distribution - Distribution Service
-
http - Web Server Service
-
eventflow - EventFlow Service
-
liveview - LiveView Service
The following service properties are supported:
-
node.applicationName
-
node.applicationVersion
-
node.applicationDescription
-
node.Last Model Request Time
-
node.Public Key
-
distribution.location code
-
liveview.Function
Service lookups filtered by these properties are supported.
Examples of runtime code requiring this support are:
-
Distribution looking up nodes by location code
-
Application name auditing
Value Constraints
- node.name
-
The service name must be 63 characters or less, contain only lower case letters, digits and dots (.), and begin and end with a lower case letter.
- node.applicationName
-
The name may be up to 63 characters in length, begin and end with an alphanumeric character([a-z0-9A-Z]) with underscores (_), dots (.), spaces ( ) and alphanumerics between.
Dash is disallowed because we are mapping space to dash, and a dash in the name breaks our ability to map back to the original UDP value.
- node.applicationVersion
-
The name may be up to 63 characters in length, begin and end with an alphanumeric character ([a-z0-9A-Z]) with underscores (_), dots (.), spaces ( ) and alphanumerics between.
Dash is disallowed because we are mapping space to dash, and a dash in the name breaks our ability to map back to the original UDP value.
- node.applicationDescription
-
No constraints.
- node.Last Model Request Time
-
No constraints.
- node.Public Key
-
No constraints.
- distribution.location code
-
No constraints.
EventFlow and LiveView Service Name
The UDP service names contain the engine name:
eventflow.some_engine_name.node.cluster
liveview.some_engine_name.node.cluster
In K8s the engine name portion is replaced by the K8s port label name. Reverse mapping back into UDP will use the port label name.
Nodes are grouped into clusters. A cluster provides unified administration and distribution services for one or more nodes. Nodes in a cluster can be running on different machine architectures, and have different product or application versions.
Clusters are dynamically created and destroyed as nodes are installed and removed. No explicit action is required to create or destroy a cluster. The cluster to create is determined from the cluster name label in the fully-qualified service name specified when a node is installed. See Service Names for details. A node can only be a single cluster — they cannot belong to multiple clusters. When all nodes in a cluster are removed, the cluster is destroyed.
An application is active as long as a cluster is active, that is, it has at least one node installed and running. If all nodes in a cluster are stopped and removed, the application is stopped and removed.
Each node has an administration address; this is a unique network address where a node listens for incoming administration requests. Administration commands are directed to a node using either the administration address, or indirectly using a discovery service lookup using a service name.
Note
It is recommend that service names be used for administration commands instead of a specific network address.
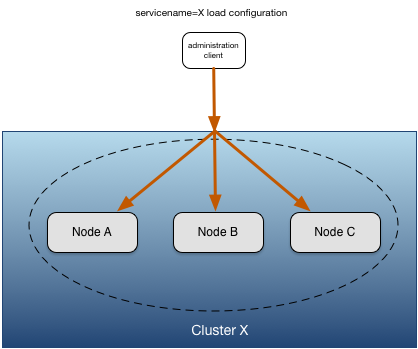
Administrative commands can be sent to multiple nodes in a cluster using a partially qualified service name. When using a
partially qualified service name, the administrative command is sent to all resolved nodes. Figure 6, “Multi-node administration commands” shows a load configuration command being sent to all nodes in cluster X with a single command. A partially qualified service name of X, which is the cluster name, is used so it resolves to all nodes in the cluster.
Nodes being addressed by either the administration network address or a service name can be in the same data center or in a different data center communicating over a WAN.
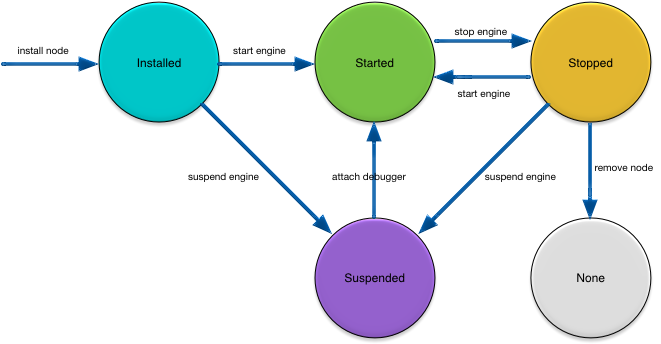
The most fundamental control that you have over a node is to manage its life cycle. A node can be installed, started, stopped, terminated, and removed, as shown in Figure 7, “Node life cycle”.
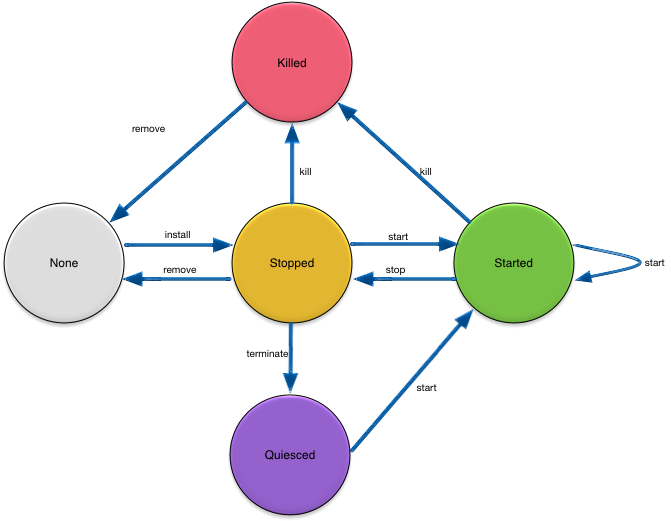
The following sections describe what happens as a node transitions between these states.
To install a node, you use an administration client to perform an install node command. As shown in Figure 8, “Installing a node”, installing a node requires:
-
the StreamBase® product to be installed on the machine on which the node is being installed.
-
the application archive for the application being installed.
-
an optional node deploy configuration file.

After a node is successfully installed, the following has occurred:
-
administration services have been started, including all node web services.
-
the application archive has been installed into the node directory.
-
the default application, security, and node deploy configuration has been loaded and activated.
-
all application fragment engines have been installed.
-
the node is in the Stopped state.
-
all node service records (node service type properties, distribution service type properties, and http service type properties) have been published.
The node can now be started
Starting a node is done using an administrative client as shown in Figure 9, “Starting a node”.
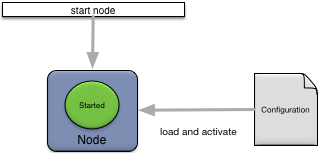
When a node is started these actions occur:
-
administration services are started, including all node web services (if transitioning from Quiesced state).
-
configuration files with engine affinity are loaded and activated.
-
all application fragment engines are started (if auto-start is true).
-
the node joins the cluster.
-
initializes (if first node in cluster), or joins, the default availability zone.
-
the node transitions to the Started state.
Starting an already started node succeeds without taking any action.
Stopping a node is done using an administrative client as shown in Figure 10, “Stopping a node”.
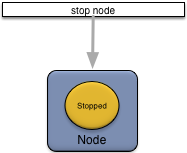
When a node is stopped these actions occur:
-
configuration files with engine affinity are deactivated and unloaded.
-
all application fragment engines are stopped.
-
the node leaves the cluster.
-
the node transitions to the Stopped state.
Terminating a node is done using an administrative client as shown in Figure 11, “Terminate a node”.
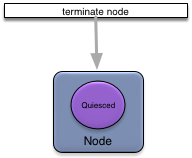
When a node is terminated these actions occur:
-
administration services are stopped, including all node web services.
-
the application, security, and node deploy configuration is deactivated and removed.
-
all node service records (node service type properties, distribution service type properties, and http service type properties) are removed.
-
the node transitions to the Quiesced state.
Removing a node is done using an administrative client as shown in Figure 12, “Removing a node”.
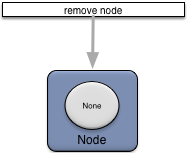
When a node is removed these actions occur:
-
administration services are stopped, including all node web services.
-
the application, security, and node deploy configuration is deactivated and removed.
-
all application fragment engines are removed.
-
all node service records (node service type properties,distribution service type properties, and http service type properties) are removed.
-
the node directory is removed.
Killing a node is done using an administrative client as shown in Figure 13, “Killing a node”.
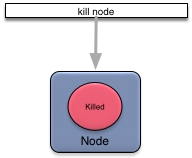
When a node is killed these actions occur:
-
all node processes are killed without a graceful shutdown.
-
all application fragment engines are killed without a graceful shutdown.
-
all node service records (distribution service type properties, and http service type properties) are removed.
-
the node leaves the cluster.
-
the node transitions to the Killed state.
One or more engines can be running on a node. Each engine hosts a single fragment and has a unique name. In the default case, there is an engine running for each fragment in an application. However, this can be changed in the node deploy configuration so that multiple engines run the same fragment.
When a node is installed, all engines are also installed. See Install Node for details.
When a node is removed, all engines are also removed. See Remove Node for details.
Figure 14, “Engine life cycle” shows the engine life cycle, which is affected by both engine and node commands. This diagram only shows the engine commands.
An engine can transition into the Started state only when a node is in the Started state (see Figure 7, “Node life cycle”).
In addition to engines being started when a node is started (see Start Node), engines can also be individually started using the start engine command as shown in Figure 15, “Starting an engine”.
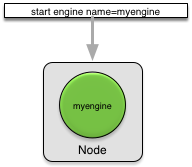
Starting an individual engine has no impact on any other engines running on a node. A started engine can be stopped as described in Stop Engine without having to stop the node.
When an engine is started, configuration is processed as follows:
-
the configuration notifier (see Configuration) is called for all currently active configurations.
-
configuration with affinity to the engine being started is loaded and activated.
-
fragment web services associated with the engine are started, if they are not already started.
-
application web services are started, if they are not already started.
Any engine specific service records (eventflow service type properties or liveview service type properties) are published.
Engines can be optionally suspended, instead of started, to facilitate debugging. Engines are individually suspended using the suspend engine command as shown in Figure 16, “Suspending an engine”.
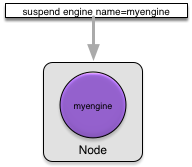
Suspending an individual engine has no impact on any other engines running on a node. A suspended engine is started by attaching a Java debugger to the engine.
Suspending an engine has no impact on the state of any configuration.
In addition to engines being stopped when a node is stopped (see Stop Node), engines can also be individually stopped using the stop engine command as shown in Figure 17, “Stopping an engine”.
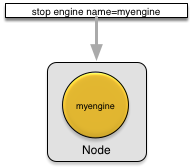
Stopping an individual engine has no impact on any other engines running on a node. A stopped engine can be restarted as described in Start Engine or suspended as described in Suspend Engine.
When an engine is stopped, configuration is processed as follows:
-
fragment web services associated with the engine being stopped are stopped, if they are not associated with any other engine.
-
application web services are stopped if no other engines are running.
-
configuration with affinity to the engine being stopped is deactivated and removed.
-
configuration loaded and activated manually (see Management Tools and Configuration) after an engine was started is not deactivated.
Any engine specific service records (eventflow service type properties or liveview service type properties) are removed.
One or more web services can be running on a node. Web services are associated with one of the following:
-
Node — node-level built-in web services, for example health check, administration, and metrics.
-
Fragment — custom web services packaged with a fragment archive.
-
Application — custom web services packaged in an application archive.
Each web service has a node-wide unique name.
When a node is installed, all node web services are also installed and started. See Install Node for details.
When a node is removed, all node web services are also removed. See Remove Node for details.
When an engine is started, all fragment and application web services associated with that engine are also started. See Start Engine.
When an engine is stopped, all fragment and application web services associated with that engine are also stopped. See Stop Engine.
Figure 18, “Web services life cycle” shows the web service life cycle, which is affected by web, engine, and node commands. This diagram only shows the web commands.
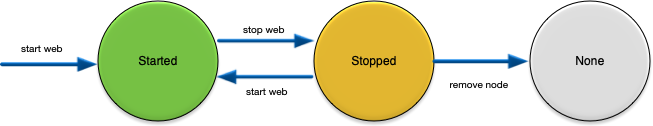
In addition to web services being started when a node or engine is started, web services can also be individually started
using the start web command as shown in Figure 19, “Starting a web service”.
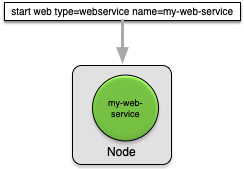
Starting an individual web service has no impact on any other web services running on a node. A started web service can be stopped as described in Stop Web Service without having to stop an engine or the node.
When a web service is started an associated service record (webservice service type properties) is published.
In addition to web services being stopped when a node or engine is stopped, web services can also be individually stopped
using the stop web command as shown in Figure 20, “Stopping a web service”.
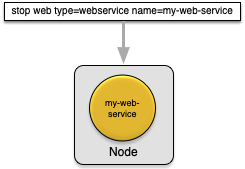
Stopping an individual web service has no impact on any other web service running on a node. A stopped web service can be restarted as described in Start Web Service.
When a web service is stopped the associated service record (webservice service type properties) is removed.
This section introduces the StreamBase® administration tools. These tools are discussed in more detail in the Administration Guide.
Administrator is a web-based GUI that supports managing all nodes in a cluster. Administrator allows any Web Browser to be used to manage clusters, nodes, and applications.
epadmin provides a command line tool to support all administrative commands. epadmin provides a simple mechanism to script operational functions.
In general, the Web client is easier to use interactively and epadmin provides advantages for scripting and easy repeatability.
All administrative commands are also supported using JMX. Platform log messages are also exposed as JMX notifications. This allows any off-the-shelf JMX console to be used to manage nodes.