StreamBase Server is instrumented with a JMX-compliant Managed Bean that provides access to status information and provides control methods similar to the sbadmin command. This allows the server to be visible to JMX-compliant network management tools such as Java JConsole or HP Openview.
The JConsole utility is provided as part of the Oracle JDK bundled with StreamBase. We use JConsole only as a freely available example of a JMX-compliant network management tool, not as the recommended tool to use. Your site's administrators may already use a commercial network management suite. If it is JMX-compliant, then StreamBase Server instances can appear in that tool's list of running applications. If your site uses SNMP-based management tools, consider adopting one of the several available JMX to SNMP bridge packages, both commercial and open source.
Start JConsole by typing jconsole in a StreamBase Command Prompt or type jconsole & in a UNIX terminal window on the same machine running StreamBase Server. JConsole starts with a dialog that prompts you to
select one of the running Java processes on the local machine.
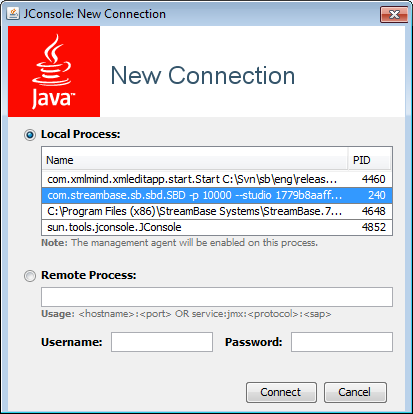 |
Running Java processes are shown by their primary class names. To monitor StreamBase Server, select the entry for com.streambase.sb.sbd.SBD.
Once connected to a StreamBase Server instance, use the tabs in the JConsole window to view status information. The following tabs may be of special interest to StreamBase users:
- Memory
-
Use the Memory tab to see a real time analysis of the memory usage and garbage collection activity of the JVM that is hosting StreamBase Server. Use this information when tuning the garbage collection settings for the server, as described in Garbage Collection Policy Settings.
- VM Summary
-
The VM Summary tab shows the VM arguments with which the server started and its classpath, among other statistics. Use this information to troubleshoot startup issues.
- MBeans
-
Use this tab to view status information and send administration commands as allowed by the server's Managed Bean. In JConsole, the relevant portion of the MBeans tab is like the following example:
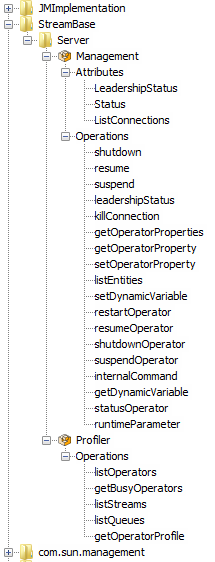
Click each Attribute node in turn and click to see current status for the specified area.
Not all Operations nodes are active. If an Operation page has an active button, then the server's MBean supports that operation. For example, click the
suspendnode, type a container name in your running application, such asdefault, and click the button. To resume that container, use analogous steps in theresumenode.The following Operations nodes in the Server Management bean have active buttons: shutdown, resume, suspend, leadership, killConnection, getDynamicVariable, and statusOperator.
All operations in the Server Profiler bean have active buttons.