Contents
You can view performance statistics for a running StreamBase application in several ways with several tools, as described in Monitoring and Profiling Applications. This page describes one of those tools, StreamBase Monitor.
For Windows, start StreamBase Monitor from a StreamBase Command Prompt (not a standard Windows command prompt), using the following command:
sbmonitor
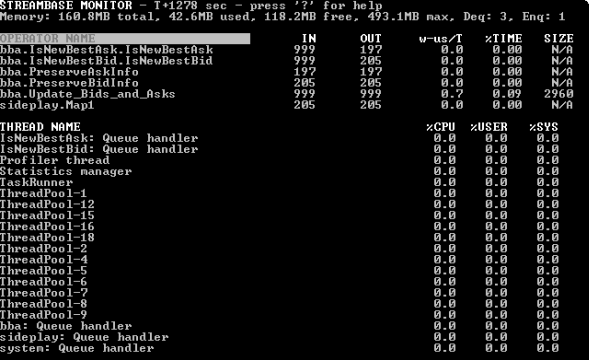
The Windows version of StreamBase Monitor looks like the following example:
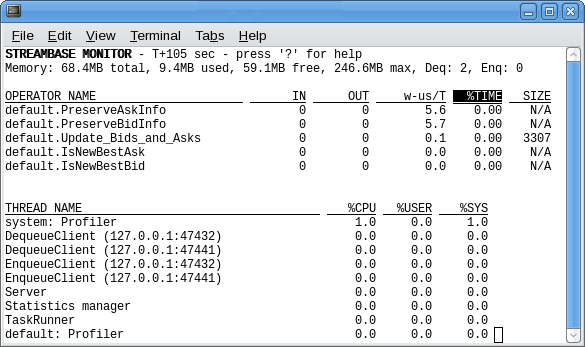
For UNIX, start StreamBase Monitor from a terminal with the same sbmonitor command. Do not use an ampersand after the command name. The command takes over terminal window you start in, much like the UNIX top utility. The UNIX version of StreamBase Monitor looks like the following example:
Without arguments, StreamBase Monitor connects to the default StreamBase Server URI, sb://localhost:10000. To connect to another server instance, use the –u option to specify a different URI. See sburi for the format of StreamBase URIs.
The following example connects to a non-default port on a remote server:
sbmonitor –u sb://wayfast.example.com:9900
To connect to a local server instance running on a non-standard port, use the –p option:
sbmonitor –p 10007
In both UNIX and Windows versions, manage the StreamBase Monitor display and sort columns by pressing the following keys:
- C
-
Toggles container names on and off in the Name column of the Operators, Profile, and Queues views. When monitoring a single-container application where the only container is named
default, you can toggle container names off for a cleaner presentation. When monitoring an application with more than one container, leave container names enabled. - H or ?
-
Replaces the bottom part of the screen with help text. Press H or ? again to see the second and subsequent pages of help text. Type Q to exit help mode and return to the view you were in.
- L
-
Toggles the bottom part of the screen between Threads view, Queues view, Streams, and Sync Threads views. Threads view is the default on sbmonitor startup.
- P
-
Toggles the top part of the screen between Operators view and Profile view. Operators view is the default on sbmonitor startup.
- S
-
Enables and disables column-sort mode for the Operators view. In column-sort mode, which is enabled by default, use the left and right arrow keys to select another column heading. The display automatically re-sorts based on the selected column. Type S to exit column sort mode.
- U
-
Toggles screen updating on and off. In an active monitoring session with many constantly updating rows, it can be hard to follow a single row across. Press U to temporarily disable screen updating; press U again to restore screen updates. This toggle does not affect the running application, only the screen display.
- Q
-
Exits sbmonitor back to the terminal prompt, or exits the H help text screen.
StreamBase Monitor can display the following information views in the main window.
-
Press P to toggle between the Operators and Profile views in the top part of the screen.
-
Press L to toggle between the Threads, Queues, Streams, and Sync Threads views in the bottom part of the screen.
- Operators View
-
Shows statistics for the StreamBase operators in all containers in the connected server. This is the default view in the top portion of the screen when sbmonitor starts.
- Profile View
-
Shows a snapshot of profiling information for StreamBase operators in the currently connected server.
- Threads View
-
Shows statistics for parallel regions running in the connected server. This is the default view in the bottom portion of the screen when sbmonitor starts.
- Queues View
-
Shows the number of tuples enqueued for each stream in the connected server.
- Streams View
-
Shows a count of tuples sent or received on each stream in the running application, including streams in the system container.
- Sync Threads View
-
Shows the number of jobs batched on the sync thread for various queues.
StreamBase Servers collect statistics for every snapshot interval. The default snapshot interval is one second, but you can adjust the length of the interval with the period-ms parameter for the <sbmonitor> element of the server configuration file.
<sbmonitor>
  <param name="period-ms" value="5000"/>
</sbmonitor>
This example sets the snapshot interval to 5 seconds (5000 milliseconds); the default is 1000 milliseconds. See <sbmonitor> for further details.
Most statistics shown in StreamBase Monitor were collected by the server in the most recent snapshot interval. However, some statistics are cumulative, such as the statistics in the Queues View. Cumulative statistics are collected since the server was started, which is the T+nnn number shown in the top line of the StreamBase Monitor screen.
Several statistics shown by StreamBase Monitor are described on this page as a weighted moving average or exponentially weighted moving average. In all cases, these are calculated as an average of 75% of the previously reported snapshot interval, plus 25% of the current snapshot interval. This provides a value calculated from history with weighting similar to that of an exponential distribution. This filters out the effects of transient non-representative extreme values.
The first two lines of the StreamBase Monitor window show the following information:
![]()
- T+nnn sec
-
The uptime in seconds of the connected StreamBase Server instance. Cumulative statistics are collected for this time period.
- Memory
-
The memory consumption of the connected StreamBase Server instance for the most recent snapshot interval, showing:
-
The total memory allocated by the server for its use.
-
The amount of memory currently used by the server.
-
The amount of memory available to use by the server.
-
The maximum memory allocatable for the server's use. (You can increase this amount by adjusting the
<java-vm>element of the server's configuration file. See <java-vm>.)
-
- Deq
-
The number of dequeue connections to the connected server.
- Enq
-
The number of enqueue connections to the connected server.
- Thr
-
The number of parallel regions implemented as threads in the JVM hosting the connected server.
You can view a reminder screen of the column heading information at the UNIX shell prompt or StreamBase Command Prompt with the following command:
sbmonitor -k
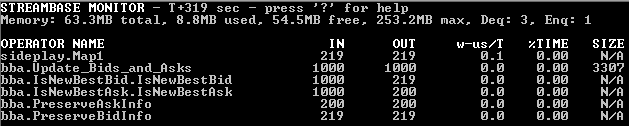
The Operators View is the default view in the top portion of the screen when sbmonitor starts. Press P to toggle between the Operators and Profile views in the top part of the screen.
This view shows the StreamBase operators currently in use on the connected server, and shows statistics about each operator.
-
Operator Name. The name of each operator qualified with its container name. Press C to toggle on and off the container names in this column.
-
In. The number of tuples enqueued on this operator's input queues during this most recent snapshot interval.
-
Out. The number of tuples output by this operator in the past second.
-
w-us/T. The exponentially weighted moving average of wall-clock time per input tuple in microseconds.
-
%Time. The current percentage of time spent in this operator.
-
Size. This value is operator dependent. For Query operators, this is the number of rows of the attached Query Table. For Aggregate operators, it is the number of windows open. For all other operators it is N/A.
Press P to toggle between the Profile and Operators views in the top part of the screen.
The Profile View shows statistics accumulated since the connected StreamBase Server instance started, which is shown by the T+nnn time in the top line. The statistics collected are the same as shown in the Operators View, and the column headings are the same as described in Operator View Columns above. The difference is that the Operators View shows what was true in the last snapshot interval (by default, one second), while the Profile View shows the accumulated statistics since the server and its application started.
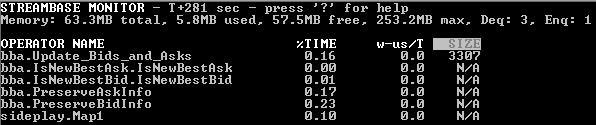
You can reconnect to the server with sbmonitor at any time to see the latest accumulated profile information. The longer an application has been running, the more accurate the profiling information. See Profiling for an overview of StreamBase profiling.
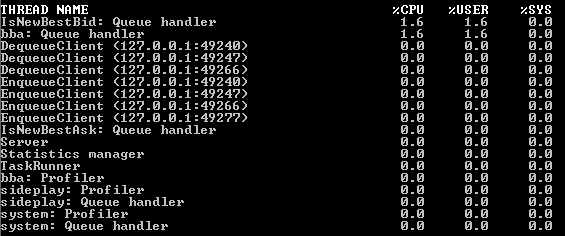
The Threads View is the default view in the bottom portion of the screen when sbmonitor starts. Press L to toggle between the Threads, Queues, Streams, and Sync Threads views in the bottom part of the screen.
This is an advanced view that shows information about threads used by components in the currently running StreamBase application. This view is of particular interest when your application uses the data concurrency option for operators and adapters. See Execution Order and Concurrency for more on using parallel execution.
Press L to toggle between the Threads, Queues, Streams, and Sync Threads views in the bottom part of the screen.
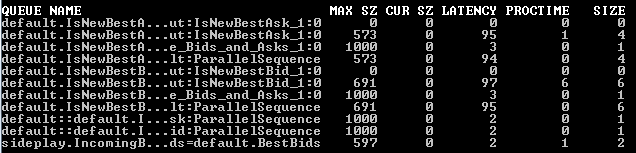
The Queues View is an advanced view for troubleshooting complex StreamBase applications that use concurrency features or container connections. For applications that do not use those features, this view shows a line for your application's input and output streams, including control streams in the system container.
Queue refers to the queue of tuples waiting to exit a stream. Every input and output stream has a queue, but the queue is normally emptied quickly as tuples flow smoothly through an application. Thus, in a healthy application, queue sizes should be zero or close to zero. The Queues View helps you diagnose possible bottlenecks in your application by identifying queues with a high tuple count. The Current Size, Latency, and Proctime columns are calculated as a moving average.
Queues process tuples in batches, which can be of variable size. In an application with high throughput, you can expect large batch sizes with possible high latency. For low latency applications, expect small batch sizes.
The Current Size, Latency, and Proctime columns reset to zero if there is no activity on the queue in the previous one second.
In complex applications, the queues of interest in the Queues View are the following:
-
In StreamBase Studio, you can flag most operators and adapters to run in separate parallel regions, using the Concurrency tab of the component's Properties view. For StreamSQL applications, you can flag Java operators, embedded adapters, and modules to run in separate parallel regions using the APPLY PARALLEL keyword. In this case, use the Queues View to monitor the queues of parallel regions. See Execution Order and Concurrency for more on using parallel execution.
-
An application configured with multiple containers can have container connections, where the output of a stream in one container is received as input to a stream in another container. If a queue for a stream in a container connection is backing up, it indicates that the downstream container (and its application) are slower than the stream produced by the upstream container. See Container Connections for further information.
-
Queue Name. Queue names are shown in a form of StreamBase path notation, and include: the name of each input and output stream in your application, including streams in the system container; the names of each parallel region for operators designated to run with parallel execution; and the names of container connections.
Queues between components show with a double colon (
::) between the affected components. Container connections show with an equals sign (=) between the two streams of the connection. An underline-number appendix designates that operator's port number; thus_1for port 1. For operators running in separate parallel regions, a zero-based region instance number is appended in the form:.instanceNumber -
Max Sz. Maximum size, the number of tuples enqueued for this stream since the connected server started.
-
Cur Sz. Current size, the approximate number of tuples currently waiting in the queue for this stream. The number is approximate because there can be multiple parallel regions accessing the queue at the same time.
-
Latency. The moving average of the time in microseconds for a batch of tuples to traverse the queue.
-
Proctime. Processing time, the moving average of the time in microseconds that it takes to process a batch of tuples.
-
Size. A moving average of the size of a batch of tuples in the queue, in number of tuples.
Press L to toggle between the Threads, Queues, Streams, and Sync Threads views in the bottom part of the screen.
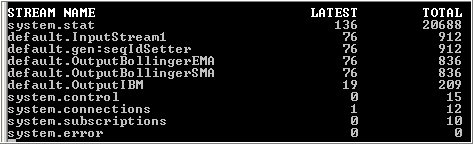
The Streams View shows the name of each output and input stream in the running application, including system container streams, and shows a running count of the total tuples emitted from each stream, and the number of tuples emitted during the most recently monitored time period.
-
Latest. The approximate number of tuples sent or received on this stream in the current snapshot interval.
-
Max Size. The maximum number of tuples sent or received on this stream since the connected server started.
Press L to toggle between the Threads, Queues, Streams, and Sync Threads views in the bottom part of the screen.
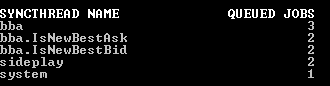
The Sync Threads View shows the number of queued jobs batched on the sync thread for various queues. See Queues View for more on queues and batches.
-
sbmonitor Command Reference
-
sbmanager Command Reference
-
Developing StreamBase Monitor Applications in the API Guide