-
In the Package Explorer view, open the MyFirstApp application that you developed earlier in the tutorial.
-
Click the
 button in Studio's top-level menu.
-
StreamBase Studio prompts for permission to switch from the SB Authoring perspective to the SB Test/Debug perspective.

-
A Performance Information dialog may also be displayed, informing you that running applications in StreamBase Studio do not support high data rates.
Click to dismiss this dialog and reveal your application running in Studio.
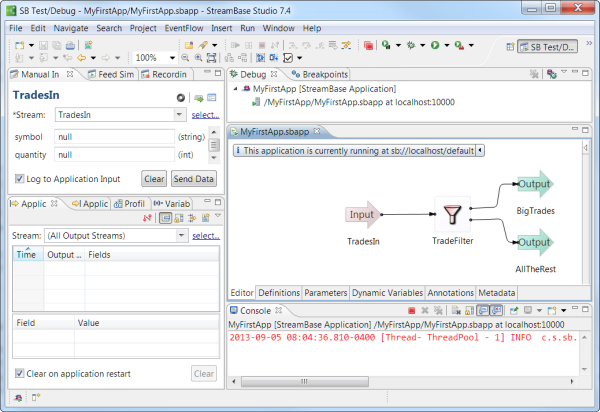
In the SB Test/Debug perspective, notice:
-
When the application starts, a message appears at the bottom left of the Studio window, confirming that the application is running.
-
A message displays on the canvas informing you of the StreamBase URI of the running application, which is usually
sb://localhost:10000orsb://localhost. -
The Console view displays a message in red text that the sbd server is listening, which means it is waiting for input. The message includes the URI and port used for the server connection, its process ID, and the version of the running StreamBase Server process.
During execution, the Console continues to display status messages and any error messages from the running server.
Note
You can also run your application with sbd from a terminal window while working in StreamBase Studio. However, that method is beyond the scope of this tutorial. That topic and many others are covered in Administration Guide.
Consider the following features of the SB Test/Debug perspective:
-
At the top of the Studio window, notice that the toolbar has changed to match the change in perspective. Some buttons that were present in the SB Authoring perspective are now gone or disabled, leaving buttons that are most useful in Test/Debug mode, such as the Stop, Debug, and Run buttons.
-
Your application remains open in the EventFlow (assuming it was already opened in the SB Authoring perspective when you clicked the Run button). A line of text displays across the top of the application window showing that the application is running.
-
In the default layout of the SB Test/Debug perspective (shown above), two views appear on the left:
-
The top left quadrant contains three views in tabs:
-
Use the Manual Input view to send any data you want to any application input stream, one tuple at time.
-
Use the Feed Simulations view to send canned data to the application instead of entering it manually. In general, the manual input method is useful for tracing the processing of individual tuples through the application, while feed simulations are useful for seeing the results of quickly sending large amounts of generated or stored data through the application.
-
Use the Recordings view to record the input and output of your testing, and to later play them back at the original speed or accelerated speeds.
-
-
The bottom left quadrant contains four views in tabs:
-
The Application Output view shows tuples as they are emitted on the application's output streams.
-
The Application Input view shows the data going into the application, listing each tuple enqueued on its input streams. You can sort the list by the order received, by input stream, or by field name.
-
The Profiler view helps you locate bottlenecks in your application by showing the resources consumed by your application's operators.
-
The Variables view is used when running your application in debug mode.
-
-
Tip
Don't forget, if a view is not open for some reason, you can open it by clicking → and navigating the menu options to choose the view you want.
There are several ways to run test data through your application, including simulations that can feed large amounts of data at high rates. The Manual Input view offers the simplest way, and it is the method we will use here. You send tuples to an input stream one at a time, and observe the application output.
-
Notice that the Field Values area is preloaded with the symbol and quantity fields from your schema, waiting for you to enter values. By default, they contain the null value.
-
Replace null with
IBMin the symbol field, and with10000in the quantity field. Click to send a new tuple to the application. As you do so, watch for output in the Application Output view. -
Because the quantity 10000 satisfies the Filter predicate, your tuple is passed through on the BigTrades stream.
-
Now change the quantity to
100and click again.This time, your output appears in the AllTheRest output stream. Why? Because the quantity is below the predicate's threshold of 10000.
-
Continue to enter different values and notice how your application responds. For example, try entering invalid data for quantity, such as
alpha. -
When you are done, click the
 button, choose → , or press the F9 key to halt the StreamBase Server and return to the SB Authoring perspective.