-
In the Project Explorer, select the
firstappproject folder. -
Navigate into
src/main/eventflow/com.example.deptname.firstappand double-click to openfirstapp.sbapp. -
Click the
 button in Studio's main toolbar, or right-click any blank space on the canvas and select >.
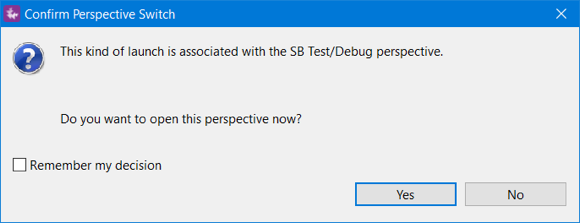
Studio prompts for permission to switch from the Authoring perspective to the SB Test/Debug perspective.

-
Click .
-
A Performance Information dialog may appear, informing you that running modules in StreamBase Studio does not support high data rates. Click .
-
Studio now installs and starts a node of the StreamBase Runtime and loads the
firstappfragment into that node.
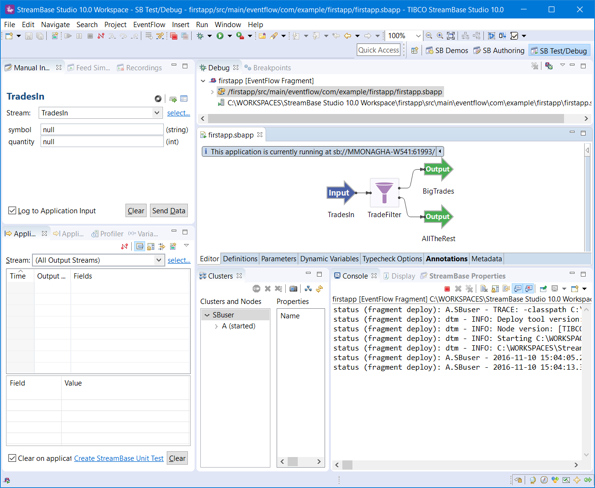
In the SB Test/Debug perspective, notice:
-
When the module starts, a message appears at the bottom left of the Studio window, confirming that the module is running.
-
A message displays on the canvas that reports information about the running module. This includes the StreamBase URI and this module's listening port, if not the default port of 10000. You must use the StreamBase URI when using certain tools to communicate with your running module from outside of Studio.
-
The Console view shows the progress of the launch, and continues to display status messages and any error messages from the StreamBase Runtime.
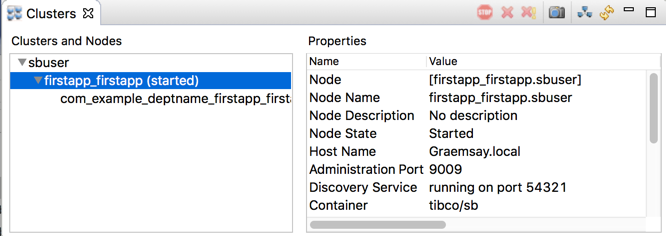
Use the Clusters view to monitor the status of your running node. The Clusters view shows cluster topology as a tree view, with the current cluster at the top of the tree. In the image below, a cluster named sbuser contains one node named firstapp_firstapp. That node contains one engine named com_example_deptname_firstapp_firstapp1.
The terms cluster, node, and engine as used in StreamBase Runtime terminology are likely to be new to you. These terms are introduced in an upcoming page of this Guide, and are explained more thoroughly on pages of the Concepts Overview.
By default, the cluster name is your system login name. You can change this default in the > panel of Studio Preferences.
 |
The currently selected node, shows (started) or (stopped) to indicate whether the node's status.
Select the node and engine rows to see details about the current running fragment.
