This chapter describes configuring and controlling distribution and high availability.
The current distribution status is available on the
Distribution Status section of the High
Availability tab for a node. The information in this display
is:
-
Node Name — local node name.
-
Distribution State — the current state of distribution on the local node (see Distribution states for details).
-
Active Distribution Listeners — the current active distribution listeners. There can be multiple active distribution listeners. Each active listener is displayed as
<engine-name>:<port-number>. -
Number of Active Nodes — current number of active remote nodes. An active remote node has connections established.
-
Number of Discovered Nodes — total number of discovered remote nodes. These nodes may have been discovered using dynamic or proxy discovery.
-
Number of Undiscovered Nodes — number of remote nodes that have never been discovered. These nodes are configured to use static discovery and have never had an active connection.
-
Number of Connections to Remote Nodes — total number of connections to all active remote nodes.
-
Number of Type Mismatches — total number of type mismatches detected from remote nodes.
-
Location Code — location code of local node.
-
Primary Distribution Listener — the current primary distribution listener for the node displayed as
<network-protocol>:<host-name>:<port-number>.
This information can also be displayed using:
epadmin --servicename=A.X display cluster --type=local
The current distribution configuration for a node can be displayed using this command:
epadmin --servicename=A.X display cluster --type=configuration
This configuration information is displayed:
-
Listener Address List — distribution listener addresses (see DistributionListenerInterface).
-
Proxy Discovery Address List — proxy discovery addresses (see ProxyDiscovery).
-
Transaction Timeout (Seconds) — distributed deadlock transaction timeout (see
Transactionconfiguration object in Transactional Memory Developers Guide). -
Node Active Timeout (Seconds) — the time to wait for a remote node to move into the
Activestate (seeDataTransportconfiguration object in Transactional Memory Developers Guide). -
Keep Alive Send Interval (Seconds) — keep-alive send interval (see
DataTransportconfiguration object in Transactional Memory Developers Guide). -
Keep Alive Non-Response Timeout (Seconds) — the non-response timeout interval following a send failure to a remote node (see
DataTransportconfiguration object in Transactional Memory Developers Guide). -
Deferred Writes Enabled —
trueindicates that writes are deferred until transaction commit,falseindicates writes occur immediately in a transaction (seeDataTransportconfiguration object in Transactional Memory Developers Guide). -
TCP No Delay Enabled —
trueindicates TCP no-delay is enabled,falseindicates that it is disabled (seeDataTransportconfiguration object in Transactional Memory Developers Guide). -
Maximum PDU Size (Bytes) — maximum Protocol Data Unit (PDU) used for distributed communication (see
DataTransportconfiguration object in Transactional Memory Developers Guide). -
Completed Transaction History Count — maximum number of completed and cancelled transactions to maintain in the transaction history (see
Transactionconfiguration object in Transactional Memory Developers Guide). -
Number of Listener Search Ports — the number of distributed listener ports to search before reporting a distribution start failure (see Communication).
-
Node Hash Size — size of internal hash to lookup node names.
-
Type Hash Size — size of internal hash to lookup managed object types.
-
Discovered Location Hash Size — size of internal hash to lookup discovered locations.
-
Secure Communication Profile Name — distribution secure communication profile (see Communication).
-
Key Store — distribution key store (see Secure Communication Server Profile).
-
Trust Store — distribution trust store (see Secure Communication Server Profile).
-
Require TLS Client Authentication — require remote node authentication (see Secure Communication Server Profile).
-
TLS Cipher List — distribution cipher list (see Secure Communication Server Profile).
-
TLS Protocol Version List — distribution TLS protocol versions (see Secure Communication Server Profile).
Distribution services are hosted in the first application engine that is started. They are stopped when this engine is stopped. In addition, a distribution configuration must be loaded and activated to enable distribution. Deactivating the distribution configuration terminates distribution, even if there is a running application engine in which they could be hosted.
The current distribution status is available on the
Distribution Status section of the High
Availability tab for a node.
Warning
Stopping distribution on an active node causes all high-availability services on the node to be disabled. This causes any partitions active on the node to failover.
Distribution can be in one of the following states:
Distribution states
Figure 1, “Distribution states” shows the state machine that controls the transitions between the distribution states.

Connectivity between nodes is established by either dynamic or proxy discovery.
-
dynamic discovery — all nodes in the cluster must be using the same discovery network address information and. The dynamic discover port is set in the node deployment configuration using the
NodeCommunication.discoveryPortconfiguration value (see Communication) or at node installation (see Application Installation for details). -
Proxy discovery — nodes configure proxy node discovery for remote nodes in the node deployment configuration. Proxy nodes are configured in the
ProxyDiscovery.remoteNodes. See rtadm-nodedeploy_config_communication for details.
Connectivity between nodes can be verified on the
Discovered Nodes section of the High
Availability tab for a node. For each remote node that has been
discovered this information is displayed:
-
Node Name — remote node name.
-
Version — distribution protocol version used by node.
-
Network Address — network address used to connect to node.
-
Current State — current state of remote node.
-
Last State Change — the time of the last state change.
-
Number of Connections — current number of active TCP connections to the node.
-
Number of Queued PDUs — current number of protocol data units queued for this remote node when using asynchronous replication. This value is always 0 if synchronous replication is being used.
-
Discovered — how the node was discovered.
-
Location Code — internally generated location identifier for this node.
This information can also be displayed using:
epadmin --servicename=A.X display cluster --type=remote
A node has a single primary distribution listener address. However, there may be multiple distribution listener addresses associated with a node. The primary distribution listener address may change as engines are started and stopped. The primary listener address is used for all new connections from remote nodes.
The primary distribution listener address can be determined using
the display cluster
--type=local
// // Node A.X currently has two distribution listener addresses, // one on port 11838 associated with engine System::administration, // and one on port 11840 associated with engine application::Dtm_sbapp0 // The listener on port 11840 is the primary distribution listener. // epadmin --servicename=A.X display cluster --type=local [A.X] Node Name = A.X [A.X] Distribution State = Running [A.X] Active Distribution Listeners = System::administration:11838,application::Dtm_sbapp0:11840 [A.X] Number of Active Nodes = 1 [A.X] Number of Discovered Nodes = 1 [A.X] Number of Undiscovered Nodes = 0 [A.X] Number of Connections to Remote Nodes = 1 [A.X] Number of Type Mismatches = 0 [A.X] Location Code = 70263 [A.X] Primary Distribution Listener = IPv4:Kapoho.local:11840 // // Display remote nodes on remote node B.X. // Node B.X is connecting to port A.X using port 11840, // which as shown above is the current primary distribution listener // address for node A.X. // epadmin --servicename=B.X display cluster --type=remote [B.X] Node Name = A.X [B.X] Version = 13 [B.X] Network Address = IPv4:Kapoho.local:11840 [B.X] Current State = Up [B.X] Last State Change = 2017-10-04 13:59:14 [B.X] Number of Connections = 5 [B.X] Number of Queued PDUs = 0 [B.X] Discovered = Dynamic [B.X] Location Code = 70263
Operators can wait for distribution to attempt to discover
remote nodes using the Discover... button on the
High Availability tab. Clicking
Discover in the dialog attempts to establish
connectivity to the specified nodes.
Nodes can also be waited to be discovered using this command:
epadmin --servicename=A.X wait cluster --nodes=B,C
Discovered nodes in the Down state can be
removed by selecting a node in the Discovered Nodes
section and clicking Remove Node. This
is useful when connectivity has been lost to a remote node, or the node
has been permanently removed from the cluster.
Nodes can also be removed using this command:
epadmin --servicename=A.X remove cluster --remotenode=B
The availability zone status fields are:
-
Availability Zone — the availability zone name.
-
Data Distribution Policy — the data distribution policy used by the availability zone.
-
Quorum State — current quorum state.
-
Rebalances Requested on Node — the number of rebalances requested on node.
-
Rebalances Executed on Node — the number of rebalances executed on node.
-
Rebalancing on Node — true if a rebalance is currently executing on node.
-
Last Rebalance on Node — time of last rebalance on node.
-
Last Rebalance Duration — duration of last rebalance executed on node.
-
Primary Nodes — active primary nodes.
-
Backup Nodes — active backup nodes.
-
Primary Node Pattern — primary node regular expression pattern.
-
Backup Node Pattern — backup node regular expression pattern.
This information is displayed using this command:
epadmin --servicename=X display availabilityzone
epadmin commands provide these different views of partition status:
-
Cluster wide summary
-
Details on a specific partition
-
Node summary
 |
The above figure shows the cluster partition summary screen that is
accessed from the High Availability Partitions folder
in the Cluster Browser. This screen provides a summary
of all partitions that are defined in every node in a cluster. A row is
displayed for each node with that node's view of the partition. The fields
in the Partitions table are:
-
Reporting Node — the node name that is reporting the information on the partition.
-
Partition Name — the partition name.
-
Partition State — the state of the partition on the node in the
Reporting Node -
Partition Status — the status of the partition on the node in the
Reporting Nodefield. -
Last State Change Time — the last time the partition state changed on the node in the
Node
                                         Name
field. -
Active Node — the active node for the partition from the perspective of the node in the
Node Namefield. -
Replica Nodes — the replica nodes for the partition from the perspective of the node in the
Node Namefield. -
Replicate To Existing — defines whether replication occurs to active replica nodes during a migration (
true) or not (false). -
Object Batch Size — number of objects locked during a migration or update of this partition.
-
Number of Threads — number of threads used during partition migration.
-
Restore From Node — node partition should be restored from in a multi-master scenario.
-
Mapped Types — list of types mapped into this partition.
-
Broadcast Definition Updates — broadcast changes in partition state to all nodes in the cluster.
-
Foreign Audit Option — audit node list if a foreign partition.
-
Replica Audit Option — audit behavior for partitions with replica nodes.
-
Remote Enable Action — Control remote enabling of the partition.
-
Availability Zone — the availability zone for the partition.
-
Partition Version — the partition version number.
This information can also be displayed using this command:
epadmin --servicename=X display partition
The partition summary screen is accessed by selecting a
specific partition under the High Availability
Partitions folder in the Cluster Browser.
This screen provides a summary of a specific partition defined in the
cluster. The fields in the Active Node section of this
screen are:
-
Node Name — the node reporting this information.
-
Active Node — the active node for the partition.
-
Partition State — the state of the partition on the active node.
-
Partition Status — the status of the partition on the active node.
-
Last State Change Time — the last time the partition state changed on the active node.
-
Replicate To Existing — defines whether replication occurs to active replica nodes during a migration (
true) or not (false). -
Object Batch Size — number of objects locked during a migration or update of this partition.
-
Number of Threads — number of threads used during partition migration.
-
Restore from Node — node partition should be restored from in a multi-master scenario.
-
Mapped Types — list of types mapped into this partition.
-
Broadcast Definition Updates — whether partition definition updates should be broadcast to other nodes in the cluster.
-
Foreign Partition Audit Option — the foreign partition audit option value.
-
Replica Audit Option — the replica audit option value.
-
Remote Enable Action — the remote partition enable option value.
-
Availability Zone — the availability zone for the partition.
-
Partition Version — the partition version number.
The information in both of these sections can also be obtained using this command:
epadmin --servicename=X display partition --name="Z"
The following steps are required to add a node to a cluster.
-
Install the node.
-
Start the node.
These commands are used to add a node to a cluster:
epadmin install node --nodename=A.X --application=application.zip
epadmin --servicename=A.X start node
Nodes can be gracefully removed from a cluster by stopping the node. When a node is stopped all active partitions on the node failover to the next highest priority replica and all replication to the node is terminated. If there is no replica node defined for a partition that is active on the node being disabled, the partition is abandoned.
The following steps are required to remove a node from a cluster:
-
Stop the node.
-
Remove the node.
A node is removed from service using these commands.
epadmin --servicename=A.X stop node
epadmin --servicename=A.X remove node
Replacing one node with another requires the following steps:
-
Install the new node.
-
Start the new node.
-
Stop the node being taken out of service.
-
Remove the node being taken out of service.
These commands are used to replace one node with another. In this
example node B.X is the new node, and node
A.X is the old node.
epadmin install node --nodename=B.X --application=application.zip
epadmin --servicename=B.X start node
epadmin --servicename=A.X stop node
epadmin --servicename=A.X remove node
To bring a node back in service following a failure, it must be restored. The steps required to restore a node to service are identical to adding a new node to the cluster. See Adding a Node to a Cluster for details.
Data distribution across nodes in an availability zone can be rebalanced dynamically on a running system. This provides a mechanism for rebalancing work among nodes in a cluster.
Warning
Data distribution policies must specifically support dynamic rebalancing. Not all data distribution policies support this feature.
Rebalancing an availability zone can also be done using this command.
epadmin --servicename=B rebalance availabilityzone --name="cluster-wide-availability-zone"
Node quorum monitoring is controlled by the
AvailabilityZone configuration (see AvailabilityZone). Node
quorum monitoring is enabled by setting the
AvailabilityZone.AvailabilityZone.minimumNumberOfVotes
configuration properties. By default, node quorum monitoring is
disabled.
When node quorum monitoring is enabled, the number of active nodes required for a quorum is determined using one of these methods:
By default, each node in a cluster has a single vote. However, this
can be changed using the AvailabilityZoneMembership
configuration (see AvailabilityZoneMembership). This allows
certain nodes to be given more weight in the node quorum calculation by
assigning them a larger number of votes.
When node quorum monitoring is enabled, high availability services
are Disabled if a node quorum is not met. This ensures
that a partition and it's associate data can never be active on multiple
nodes. When a node quorum is restored, the node state is set to
Partial or Active depending on the
number of active remote nodes. Once a quorum has been reestablished
partitions must be migrated back to the node. The current quorum state is
displayed on the High Availability tab for a
node.
Figure 2, “Node quorum votes” shows a four node cluster
using percentage of votes to determine quorum. Each node shows their
configured voting values; giving the cluster a total of nine votes when
all nodes are active. The percentageOfVotes
configuration value is set to 51%.
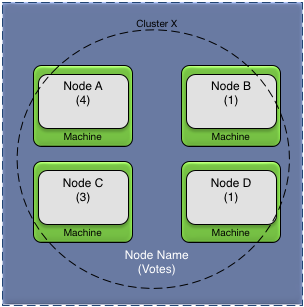
Figure 3, “Voting node quorum status — network failures” shows different scenarios based on network failures using the nodes in Figure 2, “Node quorum votes”. In this example all machines remain active — just network connectivity between the machines is lost. For each case, the disabled and active nodes, the total number of votes, and the vote percentage, is shown for the sub-cluster caused by the network failure.
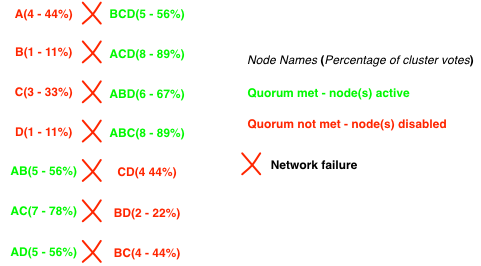
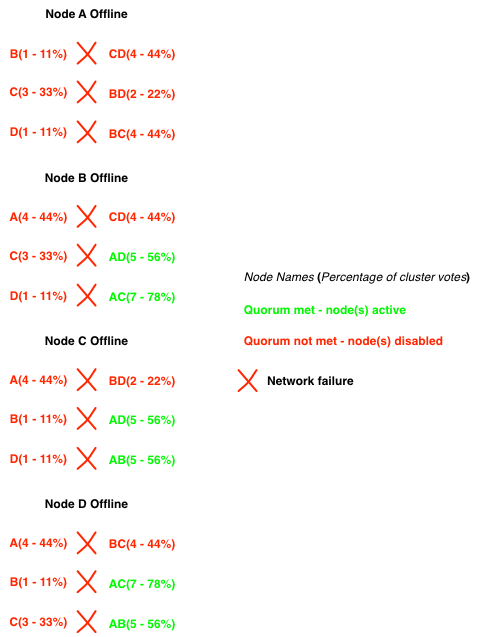
Figure 4, “Voting node quorum status — network and machine failures” shows different scenarios based on network and machine failures. For each case, the disabled and active nodes, the total number of votes, and the vote percentage, is shown for the sub-cluster caused by the network and machine failure.
When a new node deploy configuration (see NodeDeploy) is activated that changes the node quorum configuration the changes are not immediate. All changes are immediately propagated to all nodes in the cluster, but they do not take affect until a node leaves and rejoins the cluster, or a remote node fails. This ensures that a misconfiguration does not cause nodes to be taken offline unexpectedly.
The configuration values for node quorum are summarized in AvailabilityZone.
There are cases where an application can tolerate operating with partitions active on multiple nodes for periods of time. If this is acceptable behavior for an application, the node quorum monitoring should be disabled. When node quorum is disabled, the administrator must manually restore the cluster when the connectivity problem has been resolved.
The cluster partition summary display can be used to determine if partitions are active on multiple nodes. Before attempting to restore the partitions active on multiple nodes, connectivity between all nodes must have been reestablished. See Node Connectivity for details on determining the status of node connectivity in a cluster.
 |
The above figure shows partition X being
restored from node C.X to node
A.X. The partition must currently be active on both
the from and to node specified in the restore node dialog. When the
availability zone is restored on node A.X, the
partition objects are merged with the objects on node
C.X.
Clicking Enable on the High
Availability tab for a node, causes all partitions being
restored to this node to be merged with the partition specified as the
from node in the restore partition dialog, and then the partition is
made active on this node.
When these steps are complete, the cluster has been restored to service, and all partitions now have a single active node.
Restoring a cluster after a multi-master scenario can also be performed using this command.
epadmin --servicename=A.X restore availabilityzone --from=C.X
Availability zones, and their associated data distribution policy, are generally created using node deploy configuration (see AvailabilityZone). There is also a default availability zone and data distribution policy automatically defined that can be used if the default characteristics are adequate. The names of the defaults are:
-
default-cluster-wide-availability-zone— availability zone -
default-dynamic-data-distribution-policy— data distribution policy
The default availability zone has these characteristics:
-
includes all nodes in the cluster.
-
node membership is elastic as nodes are added and removed from the cluster.
-
disables quorum management.
-
uses the default data distribution policy.
The default data distribution policy has these characteristics:
-
is a dynamic data distribution policy.
-
uses distributed consistent hashing for data partitioning.
-
uses synchronous replication.
-
has a replication count of two.