This article describes how to manage the web server and web services running in a node.
The web server that hosts web services on a node is installed on a node as part of application installation. See Application Installation for details.
In addition to this article, the StreamBase Runtime REST API section of the StreamBase Administration Guide discusses the web services.
Administration is provided for both the web server and any web services running on a node. Details on current state can be displayed, along with starting and stopping them.
The status of the web server is displayed using this command:
epadmin --servicename A.X display web
This information is displayed for the web server:
-
Service Name — service name.
-
Network Address — URL to access web server.
-
Web Help UI Address — URL to access a help UI for all REST APIs exposed by installed web services.
-
Status — current status.
-
Web Services — list of all hosted web services running on the node.
The web server can be started or stopped using these commands:
//
//  Start the web server
//
epadmin --servicename A.X start web

//
//  Stop the web server
//
epadmin --servicename A.X stop web
The status of the web services running on a node is displayed using this command:
epadmin --servicename A.X display web --type webservice
This information is displayed for a web service:
-
Web Service Name — web service name.
-
Engine — engine hosting web service.
-
Base URL — base URL to REST endpoint exposed by web service.
-
Authentication Realm — authentication realm being used.
-
Documentation Endpoint — URL to REST endpoint documentation.
-
Status — current status.
These additional details are displayed when the detailed parameter is specified:
epadmin --servicename A.X display web --type webservice --detailed
-
Number of Requests with 1xx Response Status — total number of requests that received a 1xx informational response.
-
Number of Requests with 2xx Response Status — total number of requests that received a 2xx success response.
-
Number of Requests with 3xx Response Status — total number of requests that received a 3xx redirection response.
-
Number of Requests with 4xx Response Status — total number of requests that received a 4xx client error response.
-
Number of Requests with 5xx Response Status — total number of requests that received a 5xx server error response.
A web service can be started or stopped using these commands:
//
//  Start all web services installed on the node
//
epadmin --servicename A.X start web --type webservice

//
//  Stop all web services running on the node
//
epadmin --servicename A.X stop web --type webservice
When the web server is started a help UI is available. The URL for the help user interface is found in the Web Help UI Address field returned by the display web command as described in Web Server. The help UI supports:
-
selecting any web service endpoint.
-
display a full description of the REST API.
-
running any request on the availability endpoints.
-
provide credentials as required to run requests.
When a web service starts, it publishes a REST endpoint. The documentation for that endpoint is available at the URL found
in the Documentation Endpoint field returned by the display web --type webservice command as described in Web Services. This endpoint returns OpenAPI specification of the REST API, as shown in the example below. Also see Open API Specifications for Web Services in the StreamBase References.
curl --silent --user admin http://kapoho.local:8008/apidoc/healthcheck.json | json_pp
Enter host password for user 'admin':
{
   "securityDefinitions" : {
      "basicAuth" : {
         "in" : "header",
         "type" : "basicAuth",
         "name" : "basic_auth"
      }
   },
   "paths" : {
      "/status" : {
         "get" : {
            "tags" : [
               "Get the node status"
            ],
            "responses" : {
               "503" : {
                  "content" : {
                     "application/json" : {
                        "schema" : {
                           "$ref" : "#/components/schemas/NodeStatus"
                        },
                        "example" : {
                           "nodeName" : "nodeA",
                           "nodeState" : "STOPPED"
                        }
                     }
                  },
                  "description" : "Node is stopped or not discovered"
               },
               "200" : {
                  "description" : "Node is running",
                  "content" : {
                     "application/json" : {
                        "example" : {
                           "nodeName" : "nodeA",
                           "nodeState" : "STARTED"
                        },
                        "schema" : {
                           "$ref" : "#/components/schemas/NodeStatus"
                        }
                     }
                  }
               }
            },
            "summary" : "Check the current status of the node"
         }
      }
   },
   "servers" : [
      {
         "url" : "/healthcheck/v1/"
      }
   ],
   "components" : {
      "schemas" : {
         "NodeStatus" : {
            "type" : "object",
            "properties" : {
               "nodeName" : {
                  "type" : "string"
               },
               "nodeState" : {
                  "type" : "string",
                  "description" : "Node state",
                  "enum" : [
                     "STARTED",
                     "STOPPED",
                     "NOT_DISCOVERED"
                  ]
               }
            }
         }
      }
   },
   "info" : {
      "version" : "1.0.0",
      "description" : "<b>OpenAPI specification of the Health Check REST API</b>",
      "title" : "Health Check REST API"
   },
   "openapi" : "3.0.1"
}These web services are always available on a node if the web server is enabled:
-
admin — full access to all
epadminadministration commands. -
healthcheck — simple are you alive? check for a node.
-
metrics — access to all register metrics.
Each of these web services is described in more detail in the sections below.
See Open API Specifications for Web Services for the OpenAPI specifications.
The admin web service provides access to all administration commands supported by epadmin from a REST API.
The below image shows the results returned when running the display node command from the help UI:
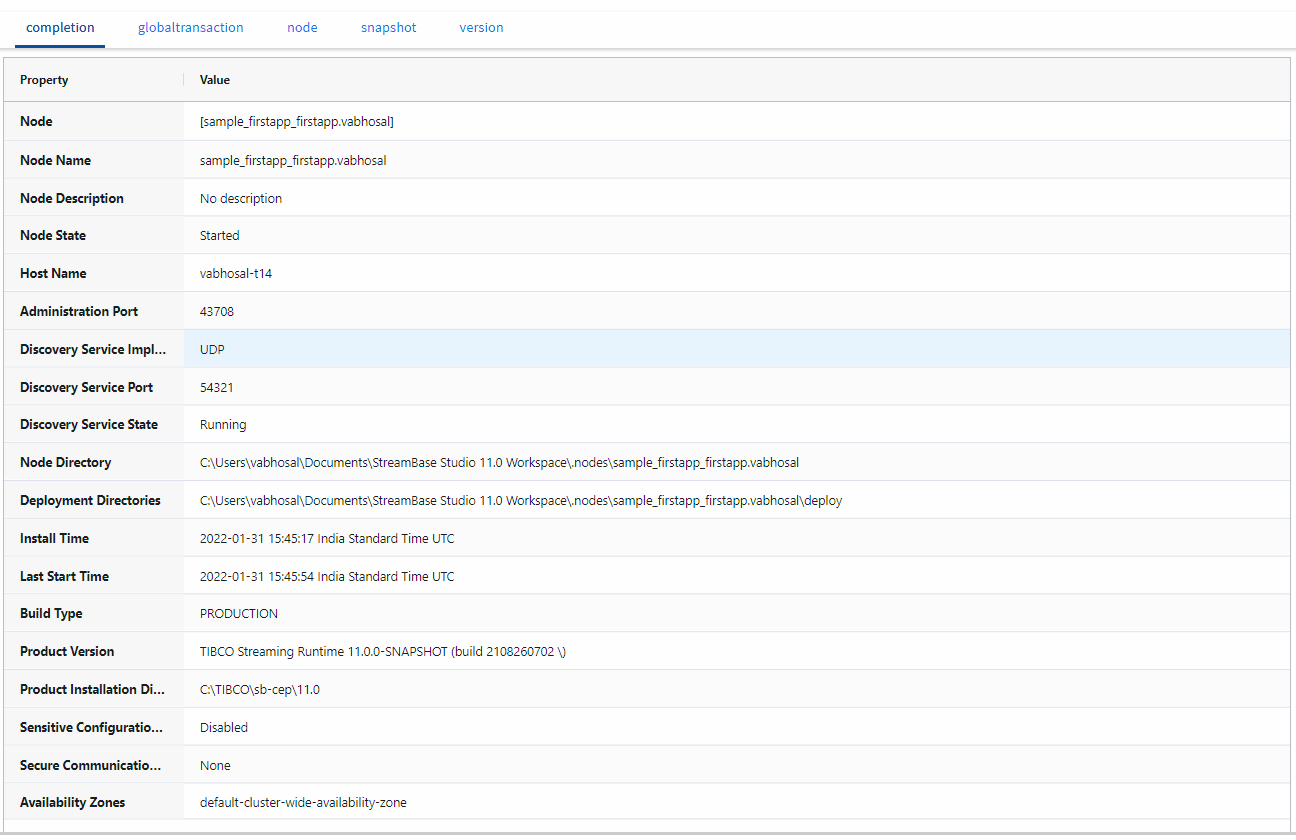 |
The display node command can also be executed using a command line tool like curl:
curl --form "parameters=" --form "files="  --silent  --user admin "http://kapoho.local:8008/admin/v1/targets/node?servicename=A.X&command=display" | json_pp
Enter host password for user 'admin':
{
   "results" : [
      {
         "statusMessage" : [],
         "columnHeaders" : [
            {
               "columnType" : "STRING",
               "columnName" : "Node"
            },
            {
               "columnType" : "STRING",
               "columnName" : "Node Name"
            },
            {
               "columnName" : "Node Description",
               "columnType" : "STRING"
            },
            {
               "columnName" : "Node State",
               "columnType" : "STRING"
            },
            {
               "columnName" : "Host Name",
               "columnType" : "STRING"
            },
            {
               "columnName" : "Administration Port",
               "columnType" : "STRING"
            },
            {
               "columnType" : "STRING",
               "columnName" : "Discovery Service Port"
            },
            {
               "columnName" : "Discovery Service State",
               "columnType" : "STRING"
            },
            {
               "columnType" : "STRING",
               "columnName" : "Node Directory"
            },
            {
               "columnType" : "STRING",
               "columnName" : "Deployment Directories"
            },
            {
               "columnName" : "Install Time",
               "columnType" : "STRING"
            },
            {
               "columnType" : "STRING",
               "columnName" : "Last Start Time"
            },
            {
               "columnType" : "STRING",
               "columnName" : "Build Type"
            },
            {
               "columnName" : "Product Version",
               "columnType" : "STRING"
            },
            {
               "columnName" : "Product Installation Directory",
               "columnType" : "STRING"
            },
            {
               "columnName" : "Sensitive Configuration Data Encryption",
               "columnType" : "STRING"
            },
            {
               "columnType" : "STRING",
               "columnName" : "Secure Communication Profile Name"
            }
         ],
         "rows" : [
            [
               "[A.X]",
               "A.X",
               "No description",
               "Started",
               "Kapoho.local",
               "19188",
               "54321",
               "Running",
               "/opt/RUN/./A.X",
               "/opt/RUN/./A.X/deploy",
               "2019-11-23 07:23:04 -0800 UTC",
               "2019-11-23 15:29:23 -0800 UTC",
               "DEVELOPMENT",
               "TIBCO StreamBase Runtime 10.6.0 (build 1911231348)",
               "/opt/tibco/sb-10",
               "Disabled",
               "None"
            ]
         ],
         "serviceName" : "A.X",
         "returnCode" : 0
      }
   ]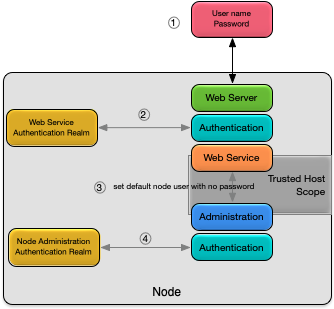
}The admin web service performs authentication as described below. In addition, the underlying administration commands that are executed on behalf of the admin REST endpoint delegate authentication to the user that was created when the node was installed (see Default Security). The execution of the administration command depends on trusted host being enabled in the node administration realm (which it is by default).
Note
If authentication is disabled for the admin web service, then the trusted host is disabled by default in the node administration realm.
Figure 1, “Admin web services authentication” summarizes the authentication process for the admin web service. Authentication consists of these steps:
-
a username and password are sent from the client user agent.
-
the username and password are authenticated using the web service authentication realm.
-
on a successful authentication, the administration command is executed with the username replaced with the default node username and no password.
-
the administration command is authenticated using the node administration authentication realm.
The healthcheck web service provides a simple check for the current node status. The returned node status can be one of:
-
STARTED -
STOPPED
The image below shows the results of the status command executed from the help UI:
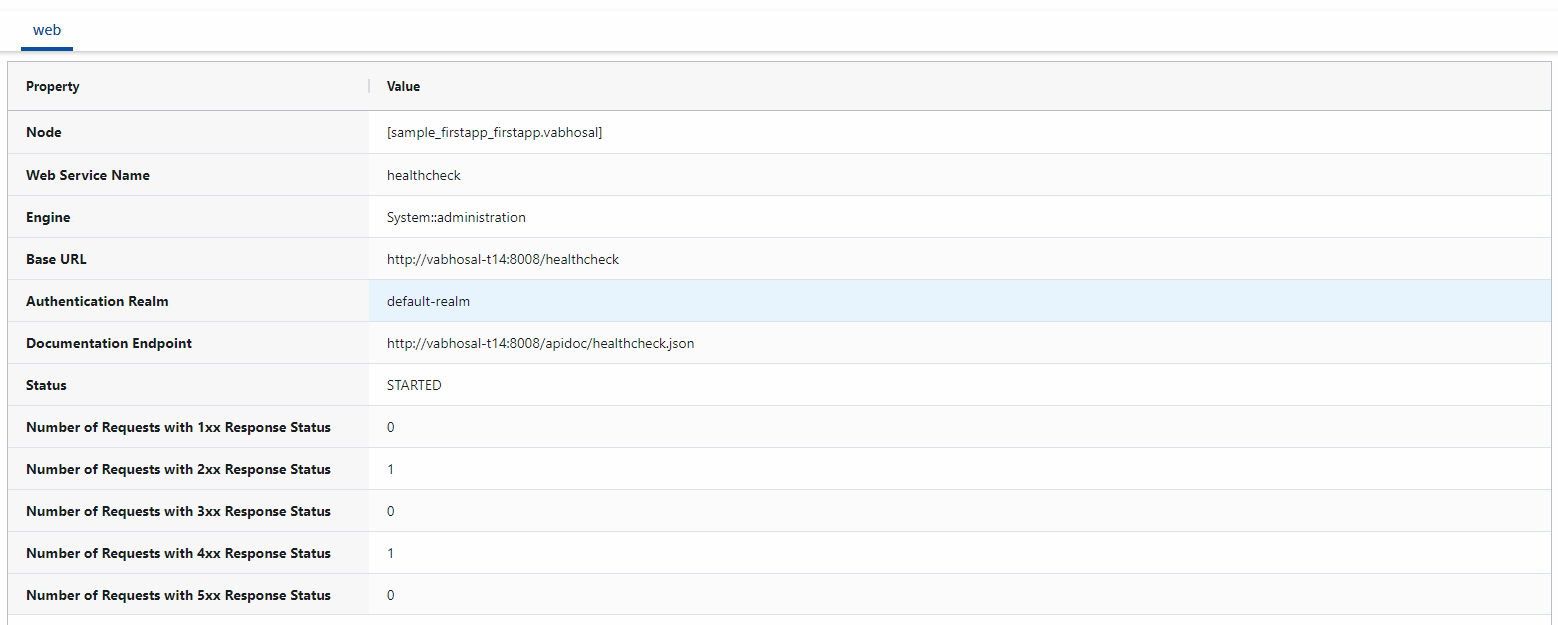 |
The status command can also be executed using a command line tool like curl:
curl --silent --user admin "http://kapoho.local:8008/healthcheck/v1/status" | json_pp
Enter host password for user 'admin':
{
   "nodeState" : "STARTED",
   "nodeName" : "A.X"
}The metrics web service provides access to all node and engine metrics from a REST API.
The image below shows the results returned when reading the builtin.node.transactions.latency.average.microseconds metric from the help UI:
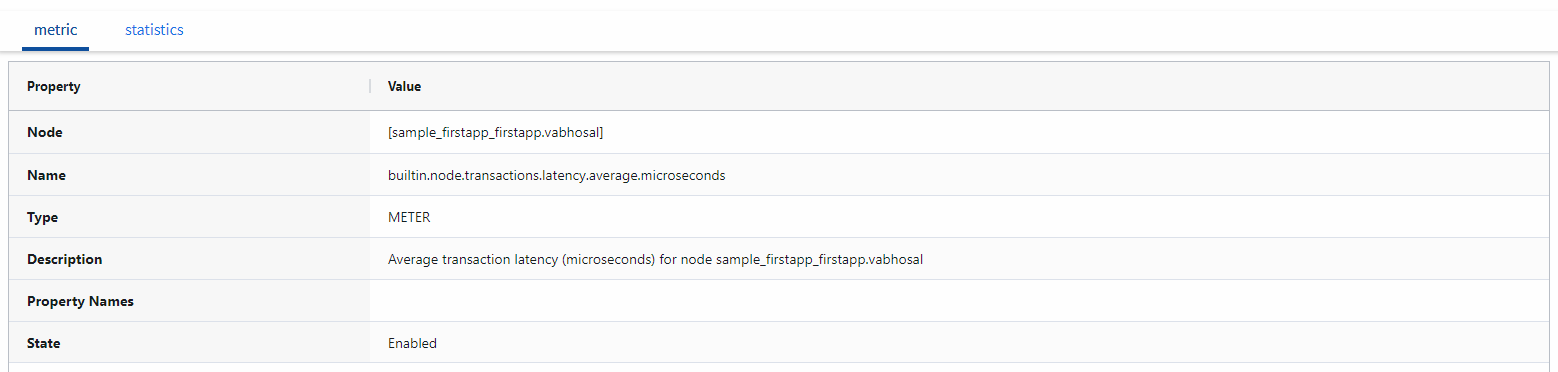 |
A metric can also be read using a command line tool like curl:
curl --silent --user admin \
  "http://kapoho.local:8009/metrics/v1/metrics/builtin.node.transactions.latency.average.microseconds" | json_pp
Enter host password for user 'admin':
{
   "description" : "Average transaction latency (microseconds) for node A.X",
   "lastUpdatedTimeStamp" : 1583539745,
   "name" : "builtin.node.transactions.latency.average.microseconds",
   "type" : "METER",
   "metric" : {
      "oneMinuteRate" : 173.391899996294,
      "fifteenMinuteRate" : 161.23666137742,
      "meanRate" : 162.895496120154,
      "count" : 301848,
      "fiveMinuteRate" : 155.835791024557
   }
}